follow us on twitter . like us on facebook . follow us on instagram . subscribe to our youtube channel . announcements on telegram channel . ask urgent question ONLY . Subscribe to our reddit . Altcoins Talks Shop Shop


This is an Ad. Advertised sites are not endorsement by our Forum. They may be unsafe, untrustworthy, or illegal in your jurisdiction. Advertise Here Ads bidding Bidding Open

Author Topic: Daily Market Analysis By FXOpen  (Read 47298 times)

Offline FXOpen Trader

  • Hero Member
  • *
  • Activity: 851
  • points:
    52859
  • Karma: 0
  • Trade Count: (0)
  • Referrals: 0
  • Last Active: April 11, 2024, 12:55:29 PM
    • View Profile

  • Total Badges: 11
    Badges: (View All)
    Second year Anniversary 500 Posts One year Anniversary
Re: Daily Market Analysis By FXOpen
« Reply #375 on: April 19, 2023, 12:36:40 AM »
XRPUSD Technical Analysis on April 18, 2023


XRPUSD Formed an Inverted Hammer Pattern Above $0.5041


Last week, the market sentiment turned bullish after Ripple touched a low of $0.5041 on April 13 and started to correct. The market opened bullish this week.

On the hourly chart:

  • The relative strength index is at 61.54, which signifies a strong demand for Ripple at the current market prices and the continuation of the bullish phase in the market.
  • Moving averages signal an upward price movement at the current market level of $0.5200.
  • Both the STOCHRSI and Williams’s percent range are in the overbought zones, which means the price is expected to decline.
  • Ripple is now trading just above its pivot level of $0.5158. It has already crossed its classic resistance at $0.5188, and it is facing Fibonacci resistance at $0.5271, after which it will be able to move towards $0.5500.

Some of the major technical indicators are bullish.

  • Ripple bullish reversal is seen above $0.5041.
  • The price is above its pivot level.
  • The average true range indicates low volatility.

We have also detected a bullish price crossover with 50- and 100-period moving averages in the daily time-frame.

VIEW FULL ANALYSIS VISIT - FXOpen Blog...

Disclaimer: This Forecast represents FXOpen Companies opinion only, it should not be construed as an offer, invitation or recommendation in respect to FXOpen Companies products and services or as Financial Advice.

Altcoins Talks - Cryptocurrency Forum

Re: Daily Market Analysis By FXOpen
« Reply #375 on: April 19, 2023, 12:36:40 AM »

This is an Ad. Advertised sites are not endorsement by our Forum. They may be unsafe, untrustworthy, or illegal in your jurisdiction. Advertise Here Ads bidding Bidding Open


Offline FXOpen Trader

  • Hero Member
  • *
  • Activity: 851
  • points:
    52859
  • Karma: 0
  • Trade Count: (0)
  • Referrals: 0
  • Last Active: April 11, 2024, 12:55:29 PM
    • View Profile

  • Total Badges: 11
    Badges: (View All)
    Second year Anniversary 500 Posts One year Anniversary
Re: Daily Market Analysis By FXOpen
« Reply #376 on: April 20, 2023, 06:50:19 PM »
ETHUSD Technical Analysis on April 20, 2023


Three Inside Down Pattern Is Below $2,140


Bulls couldn't keep control of the market, and after touching a high of $2,140 on 16 April, the ETH/USD pair declined, touching a low of $1,923 today in the early Asian trading session.

ETHUSD is under bearish pressure after falling below the $2,000 psychological support level as the global investor sentiment appears weak after the Shanghai upgrade.

The three inside down pattern is below the $2,140 handle on the H1 timeframe. It's a bearish pattern, which signifies the end of a bullish phase. Also, there is a bearish harami pattern in the H2 timeframe.

ETH is back under the pivot point, indicating the bearish pressure in the market.

The relative strength index is at 37.74, indicating very weak demand for Ether and a continuation of the selling pressure in the market.

The STOCHRSI is giving an overbought signal, meaning that the price is expected to decline in the short-term range.

We also detected the formation of the bearish harami pattern in both the 30-minute and 1-hour timeframe.

Most of the technical indicators are bearish. Most moving averages are bearish at the current market level of $1,944.

ETH is now trading below the 100-hour simple and 200-hour exponential moving averages.

  • ETH bearish reversal is seen below the $2,140 mark.
  • The short-term range is expected to be strongly bearish.
  • The average true range indicates low market volatility.

VIEW FULL ANALYSIS VISIT - FXOpen Blog...

Disclaimer: This Forecast represents FXOpen Companies opinion only, it should not be construed as an offer, invitation or recommendation in respect to FXOpen Companies products and services or as Financial Advice.

Offline FXOpen Trader

  • Hero Member
  • *
  • Activity: 851
  • points:
    52859
  • Karma: 0
  • Trade Count: (0)
  • Referrals: 0
  • Last Active: April 11, 2024, 12:55:29 PM
    • View Profile

  • Total Badges: 11
    Badges: (View All)
    Second year Anniversary 500 Posts One year Anniversary
Re: Daily Market Analysis By FXOpen
« Reply #377 on: April 20, 2023, 06:58:14 PM »
LTCUSD Technical Analysis on April 20, 2023


Bearish Engulfing Pattern Is Below $103.38


Bulls couldn't keep control of the market last week, and after touching a high of $103.38 on 18 April, the price declined against the US Dollar, touching a low of $89.06 today in the early Asian trading session.

There is a bearish engulfing pattern below the $103.38 handle on the H1 timeframe. It signifies the end of a bullish phase and the start of a bearish phase in the market.

The MACD has crossed down its moving average in the daily timeframe. Also, Litecoin is trading below its 100-hour simple moving average, 200-hour exponential moving average, and pivot level of $91.04.

The relative strength index is at 30.14, indicating very weak demand for Litecoin and the continuation of the selling pressure in the markets.

Litecoin remains below all of the moving averages, which are giving a bearish signal at current market levels of $90.37.

The STOCHRSI is signaling overbought market conditions, which means that the price is expected to decline in the short term.

The short-term outlook for Litecoin has turned strongly bearish.

  • All technical indicators a bearish
  • Litecoin bearish reversal is seen below the $103.38 level.
  • The RSI is bearish.
  • The average true range indicates low market volatility.


VIEW FULL ANALYSIS VISIT - FXOpen Blog...


Disclaimer: This Forecast represents FXOpen Companies opinion only, it should not be construed as an offer, invitation or recommendation in respect to FXOpen Companies products and services or as Financial Advice.

Offline FXOpen Trader

  • Hero Member
  • *
  • Activity: 851
  • points:
    52859
  • Karma: 0
  • Trade Count: (0)
  • Referrals: 0
  • Last Active: April 11, 2024, 12:55:29 PM
    • View Profile

  • Total Badges: 11
    Badges: (View All)
    Second year Anniversary 500 Posts One year Anniversary
Re: Daily Market Analysis By FXOpen
« Reply #378 on: April 22, 2023, 04:25:58 AM »
Watch FXOpen's April 17 - 21 Weekly Market Wrap Video

In this video, FXOpen UK COO Gary Thomson sums up the week’s happenings and discusses the most significant news reports.

  • Swiss tsunami rips through global markets: FTSE 100 wipeout noticeable
  • Abnormal balance in energy markets
  • FTSE 100 is back on track, but 8,000 points are still out of reach
  • European stocks at historic highs
  • NASDAQ hangs in the doldrums despite optimism around big tech earnings

Watch our short and informative video, and stay updated with FXOpen.


FXOpen YouTube


Disclaimer: This forecast represents FXOpen Companies opinion only, it should not be construed as an offer, invitation or recommendation in respect to FXOpen Companies products and services or as financial advice.

#fxopen #fxopenyoutube #fxopenuk #weeklyvideo

Offline FXOpen Trader

  • Hero Member
  • *
  • Activity: 851
  • points:
    52859
  • Karma: 0
  • Trade Count: (0)
  • Referrals: 0
  • Last Active: April 11, 2024, 12:55:29 PM
    • View Profile

  • Total Badges: 11
    Badges: (View All)
    Second year Anniversary 500 Posts One year Anniversary
Re: Daily Market Analysis By FXOpen
« Reply #379 on: April 24, 2023, 01:38:25 PM »
GBP/USD Eyes Bullish Breakout While EUR/GBP Consolidates Losses


GBP/USD is eyeing a key upside break above the 1.2470 resistance zone. EUR/GBP is now consolidating losses above the 0.8825 support.

Important Takeaways for GBP/USD and EUR/GBP

  • The British Pound is slowly moving higher from the 1.2365 support against the US Dollar.
  • There is a key bearish trend line forming with resistance near 1.2440 on the hourly chart of GBP/USD at FXOpen.
  • EUR/GBP started a downside correction from the 0.8860 resistance zone.
  • There is a major bullish trend line forming with support near 0.8825 on the hourly chart at FXOpen.

GBP/USD Technical Analysis


On the hourly chart of GBP/USD at FXOpen, the pair found support near the 1.2365 zone. The British Pound formed a base and started a decent increase above the 1.2400 resistance against the US Dollar.

The pair even spiked above 1.2440 and the 50-hour simple moving average. However, upsides remained capped near the 1.2470 zone. The pair is now consolidating near the 50-hour simple moving average and the 23.6% Fib retracement level of the upward move from the 1.2367 swing low to the 1.2451 high.

On the downside, there is a major support forming near the 61.8% Fib retracement level of the upward move from the 1.2367 swing low to the 1.2451 high at 1.2400.

The next major support is near the 1.2365 level. If there is a downside break below the 1.2365 support, there is a risk of a sharp decline. In the stated case, GBP/USD may perhaps revisit the 1.2300 support. Any more losses could lead the pair toward the 1.2250 support.

On the upside, resistance is near a key bearish trend line at 1.2440. The pair might attempt a fresh increase if the RSI stays above 50. The next major resistance is near the 1.2470 level. A clear move above the 1.2470 level could spark a rally toward the 1.2540 level.

VIEW FULL ANALYSIS VISIT - FXOpen Blog...

Disclaimer: This Forecast represents FXOpen Companies opinion only, it should not be construed as an offer, invitation or recommendation in respect to FXOpen Companies products and services or as Financial Advice.

Offline FXOpen Trader

  • Hero Member
  • *
  • Activity: 851
  • points:
    52859
  • Karma: 0
  • Trade Count: (0)
  • Referrals: 0
  • Last Active: April 11, 2024, 12:55:29 PM
    • View Profile

  • Total Badges: 11
    Badges: (View All)
    Second year Anniversary 500 Posts One year Anniversary
Re: Daily Market Analysis By FXOpen
« Reply #380 on: April 25, 2023, 03:57:16 PM »
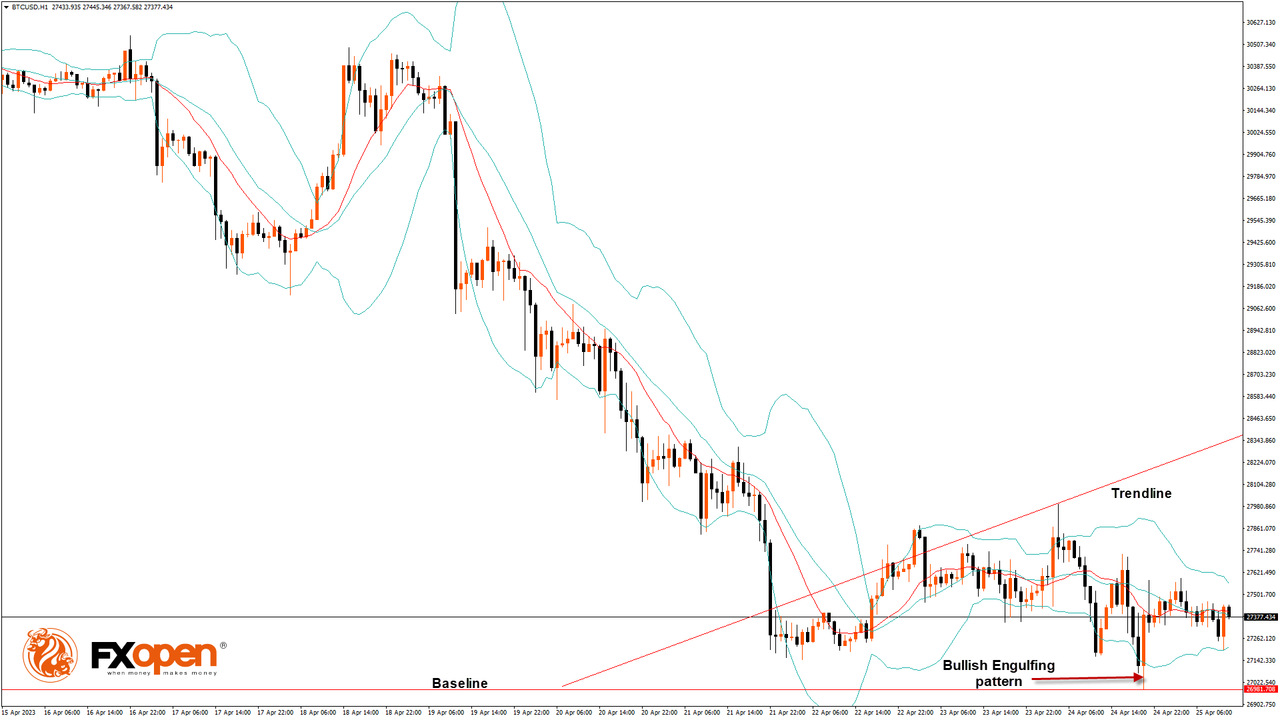
BTC/USD: Bullish Engulfing Pattern Above $26,981


Bitcoin continues its bullish momentum from last week, and after touching a low of $26,981 on April 24, we can see a move towards a consolidation phase, after which we are expecting upsides in the range of $28500 and $302000.

We can clearly see a bullish engulfing pattern above the $26,981 handle on the H1 timeframe.

Bitcoin continues to move in a consolidation phase, after which we can see upside moves towards the $28,000 handle.

Both the STOCH and Williams’ percent range indicate overbought levels, which means that in the immediate short term, a decline in the price is expected.

We can also see the formation of bullish Harami pattern in the 1, 2 and 4 hourly timeframes.

The relative strength index is at 58.23, indicating a strong demand for Bitcoin and the continuation of the buying pressure in the markets.

Bitcoin is now moving above its 200-hour exponential moving average and above its 200-hour exponential moving average.

Most of the major technical indicators are giving a bullish signal, which means that in the immediate short term, we are expecting targets of $28,500 and $30,000.

The average true range indicates high market volatility with mild bullish momentum.

  • Bitcoin bullish continuation is seen above $26,981.
  • The RSI remains above 50, indicating a bullish market.
  • The price is now trading below its pivot level of $28,516.
  • The short-term range is mildly bullish.
  • Some major technical indicators signal that the price may move to $28,000 and $29,500 soon.


VIEW FULL ANALYSIS VISIT - FXOpen Blog...

Disclaimer: This Forecast represents FXOpen Companies opinion only, it should not be construed as an offer, invitation or recommendation in respect to FXOpen Companies products and services or as Financial Advice.

Offline FXOpen Trader

  • Hero Member
  • *
  • Activity: 851
  • points:
    52859
  • Karma: 0
  • Trade Count: (0)
  • Referrals: 0
  • Last Active: April 11, 2024, 12:55:29 PM
    • View Profile

  • Total Badges: 11
    Badges: (View All)
    Second year Anniversary 500 Posts One year Anniversary
Re: Daily Market Analysis By FXOpen
« Reply #381 on: April 25, 2023, 04:01:47 PM »
XRP/USD: Three Inside UP Pattern is Above $0.4404


Last week, the market sentiment remained indecisive after Ripple touched a low of $0.4404 on April 21 and started to correct upwards. The market opened bullish this week.

On the hourly chart:

  • The relative strength index is at 53.79, which signifies a neutral demand for Ripple at the current market prices and the continuation of the bullish phase in the market.
  • Moving averages signal an upward price movement at the current market level of 0.4556.
  • Both the STOCHRSI and Williams’s percent range are in the neutral zones, which means the price is expected to consolidate further.
  • Ripple is now trading just below its pivot level of 0.4560 and is facing its classic resistance at 0.4574 and facing Fibonacci resistance at 0.4587, after which it will be able to move towards 0.4800.
  • The prices are ranging near the horizontal support.
  • CCI indicator is giving a bullish divergence signal.

Some of the major technical indicators are bullish.

  • Ripple bullish reversal is seen above 0.4404.
  • The price is below its pivot level.
  • Average true range indicates High volatility.

We have also detected that MACD crosses UP its moving average in the 15-minutes timeframe.


VIEW FULL ANALYSIS VISIT - FXOpen Blog...

Disclaimer: This Forecast represents FXOpen Companies opinion only, it should not be construed as an offer, invitation or recommendation in respect to FXOpen Companies products and services or as Financial Advice.

Altcoins Talks - Cryptocurrency Forum

Re: Daily Market Analysis By FXOpen
« Reply #381 on: April 25, 2023, 04:01:47 PM »


Offline FXOpen Trader

  • Hero Member
  • *
  • Activity: 851
  • points:
    52859
  • Karma: 0
  • Trade Count: (0)
  • Referrals: 0
  • Last Active: April 11, 2024, 12:55:29 PM
    • View Profile

  • Total Badges: 11
    Badges: (View All)
    Second year Anniversary 500 Posts One year Anniversary
Re: Daily Market Analysis By FXOpen
« Reply #382 on: April 28, 2023, 07:55:59 AM »
ETHUSD Analysis: The Morning Star Pattern above $1,786


Bulls were able to take control of the market, and after touching a low of $1,786 on 26 April, the ETH/USD pair is showing bullish momentum, touching a high of $1,938 today in the early Asian trading session.

ETHUSD is under mild bullish pressure after its decline below the $1,800 handle due to improved investor sentiment and support seen at lower levels.

The morning star pattern is above the $1,786 handle on the H1 timeframe. It's a bullish pattern, which signifies the end of a bearish phase.

The price is above the Ichimoku cloud in the 15-minutes timeframe.

ETH is back above the pivot point, indicating the bullish pressure in the market.

The relative strength index is at 57.13, indicating a strong demand for Ether and a continuation of the buying pressure in the market.

The STOCHRSI is giving neutral, meaning that the price is expected to enter into a consolidation zone in the short-term range.

We also detected the formation of the bullish trend reversal pattern with the 50-period moving average in the 15-minutes timeframe.

Most of the technical indicators are bullish. Most moving averages are bullish at the current market level of $1,885.

ETH is now trading above the 200-hour simple and 200-hour exponential moving averages.

  • ETH bullish reversal is seen above the $1,786 mark.
  • The short-term range is expected to be mildly bullish.
  • The average true range indicates high market volatility.


VIEW FULL ANALYSIS VISIT - FXOpen Blog...

Disclaimer: This Forecast represents FXOpen Companies opinion only, it should not be construed as an offer, invitation or recommendation in respect to FXOpen Companies products and services or as Financial Advice.

Offline FXOpen Trader

  • Hero Member
  • *
  • Activity: 851
  • points:
    52859
  • Karma: 0
  • Trade Count: (0)
  • Referrals: 0
  • Last Active: April 11, 2024, 12:55:29 PM
    • View Profile

  • Total Badges: 11
    Badges: (View All)
    Second year Anniversary 500 Posts One year Anniversary
Re: Daily Market Analysis By FXOpen
« Reply #383 on: April 28, 2023, 08:00:58 AM »
LTCUSD Analysis: Inverted Hammer Pattern Is above $84.29


Bulls were able to take control of the market last week, and after touching a low of $84.29 on 26 April, the price started to correct upwards against the US Dollar.

There is an inverted hammer pattern above the $84.29 handle on the H1 timeframe. It signifies the end of a bearish phase and the start of a bullish phase in the market.

The momentum indicator is back over zero in the H1 timeframe, indicating a bullish trend. There is also an upside gap located in the 15-minutes timeframe, which indicates the bullish nature of the market. We can see the formation of the Doji candle in the D1 timeframe, indicating the neutral tone of the market.

Also, Litecoin is trading below its 100-hour simple moving average, 200-hour exponential moving average, and pivot level of $91.57.

The relative strength index is at 53.164, indicating a neural demand for Litecoin and the shift towards the consolidation zone in the markets.

Litecoin remains above some of the moving averages, which is a bullish signal at the current market level of $88.33.

The CCI is signaling neutral market conditions, which means that the price is expected to move in a narrow range in the short term.

The short-term outlook for Litecoin has turned mildly bullish.

  • Some of the technical indicators are bullish.
  • Litecoin bullish reversal is seen above the $84.39 level.
  • The RSI is neutral.
  • The average true range indicates high market volatility.


VIEW FULL ANALYSIS VISIT - FXOpen Blog...

Disclaimer: This Forecast represents FXOpen Companies opinion only, it should not be construed as an offer, invitation or recommendation in respect to FXOpen Companies products and services or as Financial Advice.

Offline FXOpen Trader

  • Hero Member
  • *
  • Activity: 851
  • points:
    52859
  • Karma: 0
  • Trade Count: (0)
  • Referrals: 0
  • Last Active: April 11, 2024, 12:55:29 PM
    • View Profile

  • Total Badges: 11
    Badges: (View All)
    Second year Anniversary 500 Posts One year Anniversary
Re: Daily Market Analysis By FXOpen
« Reply #384 on: May 01, 2023, 06:50:55 AM »
Watch FXOpen's April 24 - 28 Weekly Market Wrap Video

In this video, FXOpen UK COO Gary Thomson sums up the week’s happenings and discusses the most significant news reports.

  • MSFT shares rise by more than 9%
  • AUDUSD: breakout of important support
  • NVIDIA analysis: Stock hits one-month low
  • META shares soar 11% after strong report

Watch our short and informative video, and stay updated with FXOpen.


FXOpen YouTube


Disclaimer: This forecast represents FXOpen Companies opinion only, it should not be construed as an offer, invitation or recommendation in respect to FXOpen Companies products and services or as financial advice.

#fxopen #fxopenyoutube #fxopenuk #weeklyvideo

Offline FXOpen Trader

  • Hero Member
  • *
  • Activity: 851
  • points:
    52859
  • Karma: 0
  • Trade Count: (0)
  • Referrals: 0
  • Last Active: April 11, 2024, 12:55:29 PM
    • View Profile

  • Total Badges: 11
    Badges: (View All)
    Second year Anniversary 500 Posts One year Anniversary
Re: Daily Market Analysis By FXOpen
« Reply #385 on: May 03, 2023, 07:23:04 AM »
BTCUSD Analysis: Shooting Star Pattern below $29,961


Bitcoin failed to continue its bullish momentum from last week, and after touching a high of $29,961 on April 30, it declined below the $28,000 handle today in the European trading session.

We can clearly see a shooting star pattern below the $29,961 handle on the H1 timeframe.

Bitcoin continues to move in a correction phase after crossing the $29,000 level, which is indicative of weakness in the immediate short term.

Both the STOCH and STOCHRSI are in overbought zones, which means that in the immediate short term, a decline in the price is expected.

We can see a bearish opening of the markets this week. The prices of Bitcoin are ranging near a new 1-month low.

The relative strength index is at 38.41, indicating very weak demand for Bitcoin and the continuation of the selling pressure in the market.

Bitcoin is now moving below 100-hour and 200-hour exponential moving averages.

Most of the major technical indicators are bearish, which means that in the immediate short term, we can expect a fall to $27,500 and $27,000.

The average true range indicates less market volatility with mild bearish momentum.

  • Bitcoin bearish reversal is seen below $29,961.
  • The RSI remains below 50, indicating a bearish market.
  • The price is now trading below its pivot level of $28,078.
  • The short-term range is mildly bearish.
  • Some major technical indicators signal that the price may move to $27,000 and $26,500 soon.


VIEW FULL ANALYSIS VISIT - FXOpen Blog...

Disclaimer: This Forecast represents FXOpen Companies opinion only, it should not be construed as an offer, invitation or recommendation in respect to FXOpen Companies products and services or as Financial Advice.

Offline FXOpen Trader

  • Hero Member
  • *
  • Activity: 851
  • points:
    52859
  • Karma: 0
  • Trade Count: (0)
  • Referrals: 0
  • Last Active: April 11, 2024, 12:55:29 PM
    • View Profile

  • Total Badges: 11
    Badges: (View All)
    Second year Anniversary 500 Posts One year Anniversary
Re: Daily Market Analysis By FXOpen
« Reply #386 on: May 03, 2023, 07:25:36 AM »
XRPUSD Analysis: Bearish Harami Pattern Is below $0.4869


Last week, the market sentiment remained indecisive after Ripple touched a high of $0.4869 on April 28 and started to correct downwards. The market opened bearish this week.

On the hourly chart:

  • The relative strength index is at 44.35, which signifies a weak demand for Ripple at the current prices and the continuation of the bearish phase in the market.
  • Moving averages signal a downward price movement at the current market level of 0.4626.
  • The STOCHRSI is in the oversold zone, which means the price is expected to correct upwards.
  • Ripple is now trading just below its pivot level of 0.4634 and is facing its classic support at 0.4577 and Fibonacci support at 0.4597, after which it may move towards 0.4500.
  • We have seen a bearish opening of the market.
  • Ripple is trading in a contracting range below $0.4700.

Some of the major technical indicators are bearish.

  • Ripple bearish reversal is seen below 0.4869.
  • The price is below its pivot level.
  • Average true range indicates low volatility.
  • The price is below the Ichimoku cloud, indicating a bearish trend.

The MACD indicator formed a bearish divergence in the 15-minute timeframe.


VIEW FULL ANALYSIS VISIT - FXOpen Blog...

Disclaimer: This Forecast represents FXOpen Companies opinion only, it should not be construed as an offer, invitation or recommendation in respect to FXOpen Companies products and services or as Financial Advice.

Offline FXOpen Trader

  • Hero Member
  • *
  • Activity: 851
  • points:
    52859
  • Karma: 0
  • Trade Count: (0)
  • Referrals: 0
  • Last Active: April 11, 2024, 12:55:29 PM
    • View Profile

  • Total Badges: 11
    Badges: (View All)
    Second year Anniversary 500 Posts One year Anniversary
Re: Daily Market Analysis By FXOpen
« Reply #387 on: May 04, 2023, 02:45:52 PM »
ETHUSD Analysis: Bullish Engulfing Pattern above $1,805


Bulls were able to take control of the market, and after touching a low of $1,805 on May 1, the ETH/USD pair moved upwards, touching a high of $1,916 today in the early Asian trading session. The bullish engulfing pattern is above the $1,805 handle on the H1 timeframe. It's a bullish pattern, which signifies the end of a bearish phase.

The market opened bullish this week. The ETH price remains well supported above the $1,800 level and is back above the pivot point.

The relative strength index is at 61.03, indicating a strong demand for Ether and a continuation of the buying pressure in the market.

Both the STOCH and CCI are neutral, meaning that the price is expected to enter into a consolidation zone in the short-term range.

A bullish reversal pattern with the 50-period moving average in the 2-hour timeframe was formed.

Most of the technical indicators are bullish. Most moving averages are bullish at the current Ethereum price of $1,899.

ETH is now trading above the 100-hour simple and 200-hour exponential moving averages.

  • ETH price is showing a bullish reversal above the $1,805 mark.
  • The short-term range is expected to be mildly bullish.
  • The average true range indicates low market volatility.
  • The ETH price ranges near the support of the channel.


VIEW FULL ANALYSIS VISIT - FXOpen Blog...

Disclaimer: This Forecast represents FXOpen Companies opinion only, it should not be construed as an offer, invitation or recommendation in respect to FXOpen Companies products and services or as Financial Advice.

Offline FXOpen Trader

  • Hero Member
  • *
  • Activity: 851
  • points:
    52859
  • Karma: 0
  • Trade Count: (0)
  • Referrals: 0
  • Last Active: April 11, 2024, 12:55:29 PM
    • View Profile

  • Total Badges: 11
    Badges: (View All)
    Second year Anniversary 500 Posts One year Anniversary
Re: Daily Market Analysis By FXOpen
« Reply #388 on: May 04, 2023, 03:21:48 PM »
LTCUSD Analysis: The Morning Star Pattern Is above $85.16


Bulls were able to take control of the market last week, and after touching a low of $85.16 on May 1, the price started to correct upwards against the US dollar, touching a high of $89.82 today in the early Asian trading session.

There is a morning star pattern above the $85.16 handle on the H1 timeframe. It signifies the end of a bearish phase and the start of a bullish phase in the market.

The momentum indicator is back over zero in the H4 timeframe, indicating a bullish trend.

A bullish harami pattern is forming in the 30-minute timeframe.

Also, Litecoin is trading below its 100-hour simple moving average and 200-hour exponential moving average and above its pivot level of $88.5.

The relative strength index is at 51.92, indicating a neural demand for Litecoin and the shift towards consolidation.

Litecoin price remains above some of the moving averages, which are giving a bullish signal at current market levels of $88.20.

Both the ADX and CCI are signaling neutral market conditions, which means that the price is expected to move in a narrow range in the short term.

The short-term outlook for Litecoin has turned mildly bullish.

  • Some of the technical indicators are bullish.
  • Litecoin bullish reversal is seen above the $85.16 level.
  • The RSI is neutral.
  • The average true range indicates low market volatility.


VIEW FULL ANALYSIS VISIT - FXOpen Blog...

Disclaimer: This Forecast represents FXOpen Companies opinion only, it should not be construed as an offer, invitation or recommendation in respect to FXOpen Companies products and services or as Financial Advice.

Offline FXOpen Trader

  • Hero Member
  • *
  • Activity: 851
  • points:
    52859
  • Karma: 0
  • Trade Count: (0)
  • Referrals: 0
  • Last Active: April 11, 2024, 12:55:29 PM
    • View Profile

  • Total Badges: 11
    Badges: (View All)
    Second year Anniversary 500 Posts One year Anniversary
Re: Daily Market Analysis By FXOpen
« Reply #389 on: May 08, 2023, 06:42:55 AM »
Watch FXOpen's May 1 - 5 Weekly Market Wrap Video

In this video, FXOpen UK COO Gary Thomson sums up the week’s happenings and discusses the most significant news reports.

  • Unexpected interest rate hike in Australia strengthens AUD
  • Market reaction to the Fed's decision
  • Crude oil is at lowest point in over a month as US economy teeters and supply changes
  • The Netflix chill – shares hit one-month low over past few days

Watch our short and informative video, and stay updated with FXOpen.


FXOpen YouTube


Disclaimer: This forecast represents FXOpen Companies opinion only, it should not be construed as an offer, invitation or recommendation in respect to FXOpen Companies products and services or as financial advice.

#fxopen #fxopenyoutube #fxopenuk #weeklyvideo


ETH & ERC20 Tokens Donations: 0x2143F7146F0AadC0F9d85ea98F23273Da0e002Ab
BNB & BEP20 Tokens Donations: 0xcbDAB774B5659cB905d4db5487F9e2057b96147F
BTC Donations: bc1qjf99wr3dz9jn9fr43q28x0r50zeyxewcq8swng
BTC Tips for Moderators: 1Pz1S3d4Aiq7QE4m3MmuoUPEvKaAYbZRoG
Powered by SMFPacks Social Login Mod