follow us on twitter . like us on facebook . follow us on instagram . subscribe to our youtube channel . announcements on telegram channel . ask urgent question ONLY . Subscribe to our reddit . Altcoins Talks Shop Shop


This is an Ad. Advertised sites are not endorsement by our Forum. They may be unsafe, untrustworthy, or illegal in your jurisdiction. Advertise Here

Show Posts

This section allows you to view all posts made by this member. Note that you can only see posts made in areas you currently have access to.


Messages - FXOpen Trader

Pages: 1 ... 55 56 [57]
841
Advertise Your Stuff / Re: FXOpen – FXOpen.com
« on: October 25, 2021, 12:30:24 PM »
Setting FXOpen Servers To Winter Time


Dear Clients,

Please note that on November 7, 2021, FXOpen will set its trading servers to winter time, i.e., from GMT+3 to GMT+2.

The changes are to come into effect at the time of market opening on Monday, November 8, 2021. On crypto accounts where trading is available over the weekend, traders will notice the changes a day earlier, on Sunday, November 7, 2021.

The time switch will be applied to all types of trading accounts on the FXOpen platform.

The server time switch will not affect any open trades or the process of placing, closing, or modifying orders. However, we would recommend that you take the time shift into account when planning your trading activities.

And, finally, please do not forget to synchronize the time zone of your EAs and indicators with FXOpen’s server, which is GMT+2.

FXOpen Company News

842
Advertise Your Stuff / Re: Daily Market Analysis By FXOpen
« on: October 25, 2021, 08:21:21 AM »
GBP/USD and EUR/GBP Aim More Upsides


GBP/USD is eyeing an upside break above the 1.3820 resistance zone. EUR/GBP is rising and it could gain pace if it clears the 0.8465 resistance.

Important Takeaways for GBP/USD and EUR/GBP

  • The British Pound was able to gain pace above the 1.3700 and 1.3750 resistance levels.
  • There is a key rising channel forming with support near 1.3760 on the hourly chart of GBP/USD.
  • EUR/GBP formed a support base above 0.8420 and started a fresh increase.
  • There was a break above a major bearish trend line with resistance near 0.8440 on the hourly chart.

GBP/USD Technical Analysis

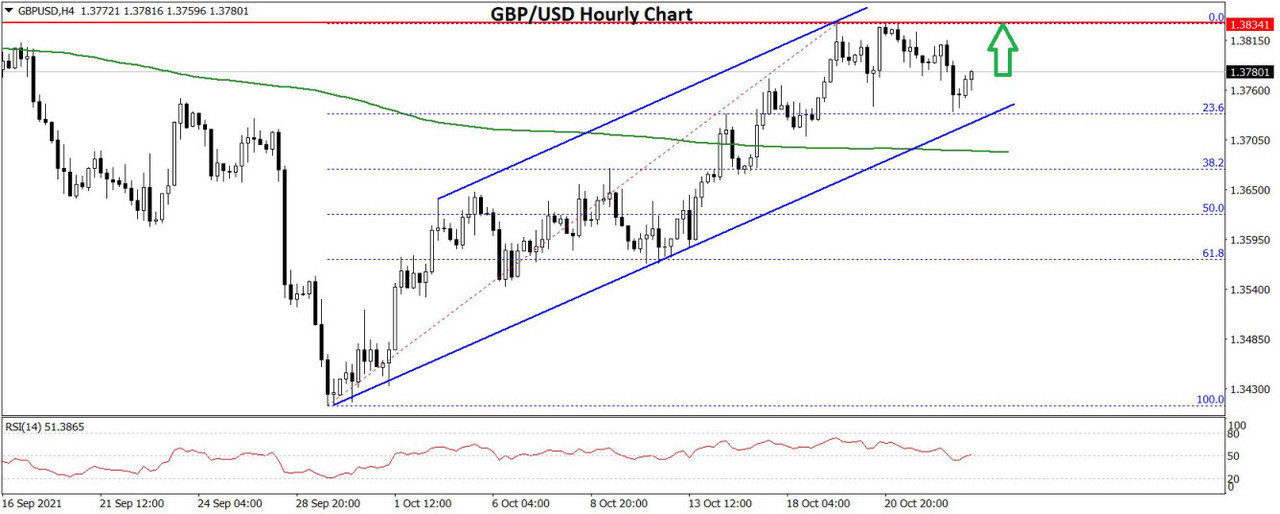
The British Pound started a major increase from the 1.3440 support zone against the US Dollar. The GBP/USD pair traded above the 1.3600 resistance zone to move into a positive zone.

The pair even broke the 1.3750 resistance zone and settled above the 50 hourly simple moving average. It even spiked above 1.3800 and traded as high as 1.3835. GBP/USD is now correcting gains and trading below 1.3800.

GBP/USD Hourly Chart


An immediate support is near the 1.3760 level. It is near the 23.6% Fib retracement level of the upward move from the 1.3413 swing low to 1.3835 high.

It is now consolidating near the 1.3780 level. There is also a key rising channel forming with support near 1.3760 on the hourly chart of GBP/USD. A downside break below the channel support might even push the pair below the 1.3700 support zone.

The next major support is near the 1.3650 level. The 50% Fib retracement level of the upward move from the 1.3413 swing low to 1.3835 high is also near the 1.3650 zone.

Any more downsides might call for a move towards the 1.3600 level. On the upside, the pair is facing resistance near 1.3820. If there is an upside break above the 1.3820 resistance, the price could surpass 1.3850.

The next main resistance is near the 1.3920 zone, above which the pair could rise towards the 1.4000 level in the near term.

Read Full on FXOpen Company Blog...

843
Advertise Your Stuff / Re: Daily Market Analysis By FXOpen
« on: October 22, 2021, 07:32:02 AM »
Gold Price and Crude Oil Price Eye Upside Break


Gold price is facing resistance near $1,790 and $1,800. Crude oil price remains elevated above the key $80.00 pivot level and it is eyeing more upsides.

Important Takeaways for Gold and Oil

  • Gold price started a decent increase above the $1,760 resistance against the US Dollar.
  • There was a break above a major contracting triangle with resistance near $1,785 on the hourly chart of gold.
  • Crude oil price extended its rally towards the $83.70 level before it started a downside correction.
  • There is a key bullish trend line forming with support near $81.30 on the hourly chart of XTI/USD.

Gold Price Technical Analysis

Gold price started a fresh increase above the $1,750 pivot level against the US Dollar. The price gained pace and it was able to settle above the $1,780 resistance zone.

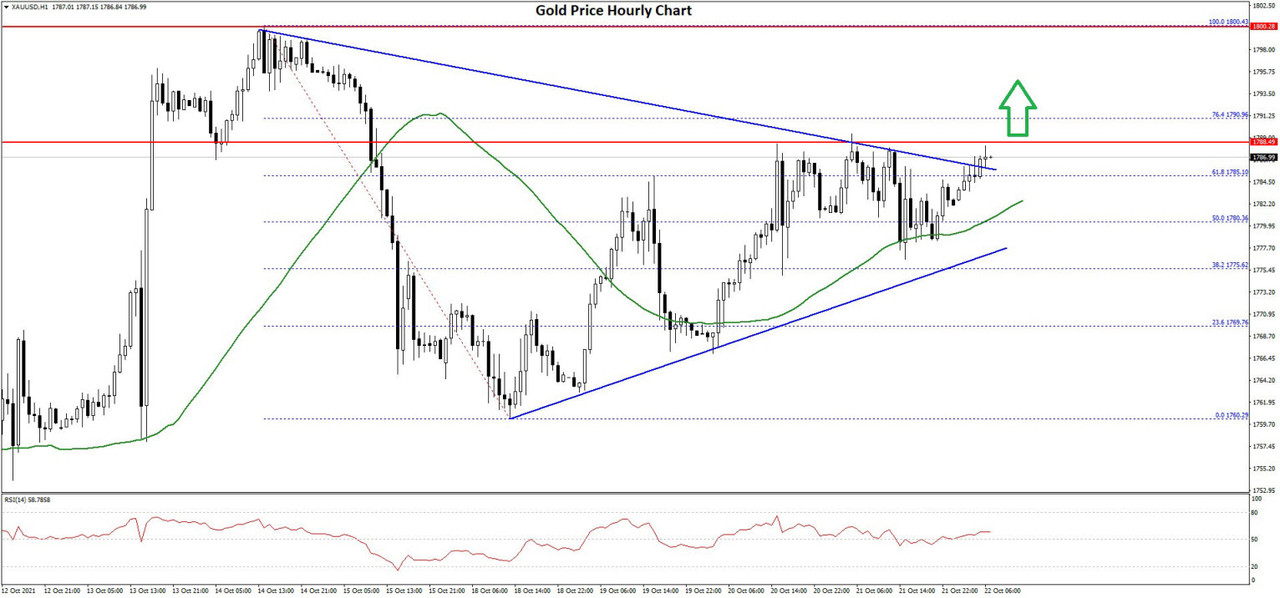
A high was formed near $1,800 on FXOpen and the price corrected lower. There was a break below the $1,780 and $1,775 levels. However, the bulls were active above the $1,750 level. A low was formed near $1,760 and the price is now rising.

Gold Price Hourly Chart


The price is back above the $1,780 level and the 50 hourly simple moving average. It also surpassed the 50% Fib retracement level of the key drop from the $1,800 swing high to $1,760 low.

There was also a break above a major contracting triangle with resistance near $1,785 on the hourly chart of gold. An immediate resistance on the upside is near the $1,788 and $1,790 levels. It is near the 76.4% Fib retracement level of the key drop from the $1,800 swing high to $1,760 low.

The first major resistance is near the $1,792 level. The main resistance is near the $1,800 level. A close above the $1,800 level could open the doors for a move towards $1,820.

On the downside, the first major support is near the $1,782 level and the 50 SMA. A downside break below the $1,762 support zone may possibly call for a test of the $1,765 support zone in the near term.

Read Full on FXOpen Company Blog...

844
Advertise Your Stuff / Re: Daily Market Analysis By FXOpen
« on: October 21, 2021, 04:10:35 PM »
ETHUSD and LTCUSD Technical Analysis – 21st OCT, 2021


ETHUSD: Bullish Engulfing Pattern Above $4000

Ethereum is moving in a strong bullish momentum after clearing the psychological resistance level of $4000. The price of ETHUSD touched an intraday high of $4241 in the Asian trading session and is now preparing for its next rally towards the $5000 handle.

ETH is now trading above its pivot level of $4157 and Fibonacci resistance level of $4169. The price of Ethereum is surging continuously today and is about to break its classic resistance level of $4206.

Ether is expected to maintain the bullish tone this week and continue towards the $4500 mark as the bulls take over. All the major technical indicators are giving a BUY signal.

ETH is now moving above both the 100 hourly and 200 hourly simple moving averages. Bullish engulfing pattern above $4000 suggests that we could witness a fresh rally towards $5000 soon.

  • Ethereum continues to remain above the psychological level of $4000
  • Short-term to medium-term outlooks remain bullish for ETHUSD
  • All the moving averages are giving a STRONG BUY signal
  • The pair is expected to touch $4500 in the US trading session today

Ether’s Rally Towards $5000 Confirmed


ETHUSD is consolidating its gains above $4000 and is now preparing for its next upwards move against the US dollar. ETH is now facing its next major resistance levels of $4240 and $4320, after which the path towards $4500 will get cleared.

After surging above $4000, Ethereum’s volatility is low, suggesting that now investors are waiting to enter the market anticipating a major bullish move.

ETH has gained 8.79% with a price change of +$339.35 in the past 24hrs and has a trading volume of 24.516 billion USD.

Ethereum ETF

The total market capitalization of Ethereum continues to increase, and at present is valued at 455 billion USD. The investors are eagerly waiting for the launch of Ethereum ETF in the US markets, which would bring a larger number of investors into its domain.

Grayscale has announced its plans to launch an ETF based on Ethereum. At the moment, 4 Ethereum ETFs are trading in Canadian securities exchange, and plans are on to launch in the US market.

Some crypto analysts believe that with the Ethereum ETFs, more institutional investors will come in, leading to its higher demand and a surge in the price well above $6000.

The Week Ahead

Ethereum dips remain well supported, and an increased buying pressure is seen above the $4000 mark. The bullish trend continues from last week. Any bearish corrections will serve as a buying opportunity for long-term traders.

This week we may witness Ethereum touching the levels of $4500 — and then extending its rally towards the $5000 handle in the opening of the next week.

As the price of ETHUSD remains above its 100 hourly exponential moving average, a breakout above $4400 is expected this week.

Technical Indicators:

Average directional change (14-day): at 48.125 indicating a BUY

Bull/Bear power (13-day): at 47.63 indicating a BUY

Rate of price change: at 1.148 indicating a BUY

Moving averages convergence divergence (12,26): at 66.36 indicating a BUY

Read Full on FXOpen Company Blog...

845
Advertise Your Stuff / Re: FXOpen – FXOpen.com
« on: October 20, 2021, 09:23:01 AM »
FXOpen TickTrader

TickTrader: a unifying solution for unbounded trading

What does TickTrader have to offer?


846
Advertise Your Stuff / Re: Daily Market Analysis By FXOpen
« on: October 20, 2021, 06:48:24 AM »
EUR/USD Eyes Recovery, USD/CHF Could Break Higher


EUR/USD started a fresh rise above the 1.1620 resistance zone. USD/CHF is eyeing an upside break above the 0.9260 resistance zone in the near term.

Important Takeaways for EUR/USD and USD/CHF

  • The Euro started a fresh recovery wave above the 1.1600 zone against the US Dollar.
  • There is a key bullish trend line forming with support near 1.1605 on the hourly chart of EUR/USD.
  • USD/CHF started a decent increase from the 0.9185 support zone.
  • There is a major bearish trend line forming with resistance near 0.9250 on the hourly chart.

EUR/USD Technical Analysis

The Euro formed a base above the 1.1530 zone against the US Dollar. As a result, the EUR/USD pair started a fresh increase above the 1.1550 and 1.1560 resistance levels.

The pair was able to clear the 1.1600 resistance and the 50 hourly simple moving average. It even spiked above 1.1650 resistance. A high was formed near 1.1669 on FXOpen and the pair is now correcting lower.

EUR/USD Hourly Chart


There was a break below the 23.6% Fib retracement level of the upward move from the 1.1572 swing low to 1.1669 high. It is now consolidating near the 1.1635 level and above the 50 hourly simple moving average. An immediate support is near the 1.1625 level.

It is near the 50% Fib retracement level of the upward move from the 1.1572 swing low to 1.1669 high. The next major support is near the 1.1605 level. There is a key bullish trend line forming with support near 1.1605 on the hourly chart of EUR/USD.

A downside break below the 1.1600 support could start another decline. The next major support sits near 1.1550. On the upside, an initial resistance is near the 1.1650 level.

The main resistance is near 1.1665. If there is an upside break above the 1.1665 resistance zone, the price could rise steadily towards the 1.1720 resistance zone.

Read Full on FXOpen Company Blog...

847
Advertise Your Stuff / Re: Daily Market Analysis By FXOpen
« on: October 19, 2021, 08:24:32 PM »
BTCUSD and XRPUSD Technical Analysis – 19th OCT, 2021


BTCUSD: Bitcoin Rally Towards $65k Confirmed

Bitcoin continues to consolidate its gains and has touched a 6-month high of $62,965 in the Asian trading session. Since the price of BTC has already crossed its major resistance levels of $62,232 today, we may see some consolidation in the levels towards sub $62,000 handle in the US trading session.

Bitcoin is trading above its both 100 hourly and 200 hourly moving averages. The rally in BTC continues with fresh buying support seen after it touched an intraday low of $61,100 today in the early Asian trading session.

Bitcoin is moving in a strong bullish momentum, and a fresh rally is expected to push its prices above the $65,000 handle this week.

The medium to long-term outlook for bitcoin remains bullish with immediate targets for today at $63,200.

  • Bitcoin is holding above its major resistance levels of $58,462, indicating more upsides
  • Consolidation in the prices is expected after touching a 6-month high towards $61,400 level
  • The price is now trading above its classic support level of $61,860
  • All the moving averages are giving a STRONG BUY signal at current market levels of $62,108

Bitcoin Consolidating Its Gains Above $60k


BTCUSD is gaining momentum. Its price continues to remain above the important psychological level of $60k. At the moment, the price of BTCUSD is facing a Fibonacci resistance level of $62,531, and Woodies resistance level of $62,798, after which the path towards $63,000 will be cleared.

In the last 24hrs, BTCUSD has risen UP by +0.83% / +825$ and has a 24hr trading volume of USD 39.152 billion.

Bitcoin Acceptance Increases

The global acceptance of bitcoin is growing. The number of BTC transactions continues to increase, which leads to its higher demand on cryptocurrency exchanges.

This year, residents of Brazil have bought 4 billion USD worth of crypto, including bitcoin. Brazil is expected to pass a bill to legalize bitcoin as legal tender.

Investments in bitcoin are expected to grow as well, with the listing of bitcoin exchange traded funds (ETFs). Some crypto analysts believe that bitcoin ETFs will allow billions of dollars managed by pension funds and other institutional investors to flow into bitcoin.

The Week Ahead

The price of BTCUSD is holding above $60,000, and after some consolidation, the bullish uptrend movement will start pushing its price above the $63,000 handle.

If the prices of BTCUSD continue to remain above the $63,000 mark this week, we may see a fresh rally towards $65,000 in the markets in the opening of the next week.

Both the medium- and long-term outlooks remain positive. Next week, we may witness BTC printing at above the $65,000 mark.

Technical Indicators:

Ultimate oscillator: at 58.88 indicating a BUY

Rate of price change (ROC): at 0.653 indicating a BUY

Moving averages convergence divergence (12,26): at 228.80 indicating a BUY

Relative strength index (14-day): at 55.39 indicating a BUY

Read Full on FXOpen Company Blog...

848
Advertise Your Stuff / Re: Daily Market Analysis By FXOpen
« on: October 19, 2021, 08:21:31 PM »
Bitcoin Trades Back Above $60,000, Eyes New Record Highs


Cryptocurrency traders and investors are cheering the recent bitcoin rally. The leading cryptocurrency is trading back above $60,000, coming close to a new all-time high.

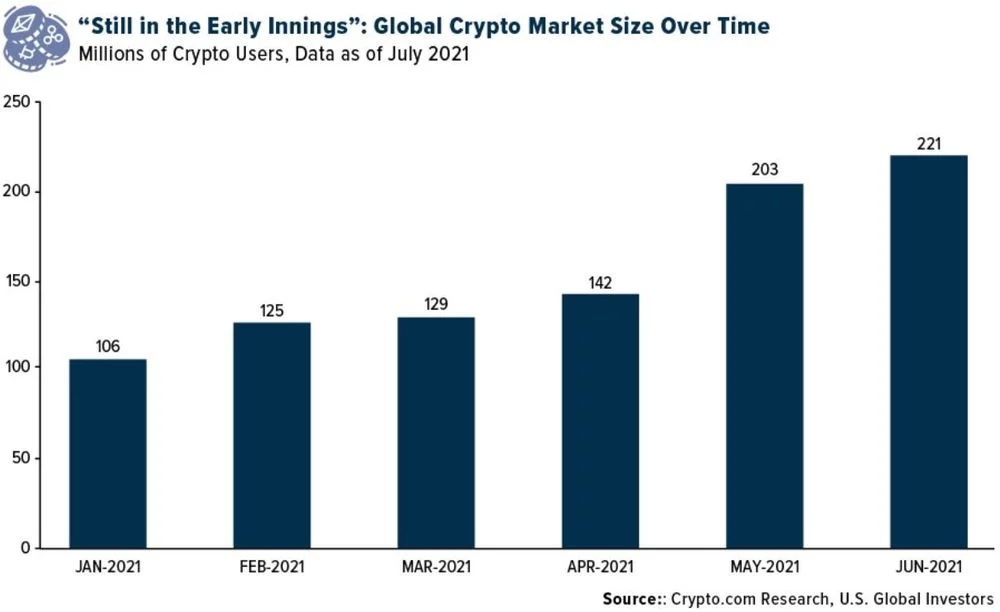
The most recent data related to the crypto market size explains why bitcoin has attracted so many buyers in the latest months. The global crypto market size keeps growing, with more and more people shifting their gaze to crypto assets. In a single month, from May to June 2021, the crypto market added 18 million new users. Because bitcoin is the most popular coin, it is likely that the new funds injected into the crypto space went to it.


Bullish Developments in the Crypto Space

Besides the increased popularity in the cryptocurrency space, as suggested by the rising number of crypto users, some other recent bitcoin-related events can be characterized as bullish.

One comes from the Security and Exchange Commission (SEC). It is poised to approve the first-ever bitcoin ETF, which would open the space to a much wider investors base. This news alone was largely responsible for bitcoin’s recent rally. An ETF is an exchange-traded fund that tracks the price movements of its underlying – in this case, bitcoin. Investors favor ETFs due to them being a cost-efficient way of trading expensive assets.

Another such driver is the Bank of America’s decision to introduce coverage of digital assets as the cryptocurrency market reached $2 trillion in market value.

The recent developments triggered enthusiasm among crypto traders, and so the crypto market continues to rise. In the meantime, bitcoin has surpassed Facebook in terms of market value and is on track to take the silver.

Bitcoin traded close to $65,000 back in April this year, and it corrected after Elon Musk, the CEO of Tesla, suggested that the digital asset is too expensive. The current upwards movement also helps Tesla, as the company holds more than $1 billion worth of bitcoins on its balance sheet.

FXOpen Blog

849
Advertise Your Stuff / Daily Market Analysis By FXOpen
« on: October 19, 2021, 08:20:00 PM »
GBP/USD Eyes More Upsides, USD/CAD Faces Hurdles


GBP/USD started a fresh increase from the 1.3400 support zone. USD/CAD is declining, and it is facing resistance near 1.2400.

Important Takeaways for GBP/USD and USD/CAD

  • The British Pound found support above 1.3400 and started a fresh increase.
  • There is a key bullish trend line forming with support near 1.3690 on the hourly chart of GBP/USD.
  • USD/CAD started a major decline from well above the 1.2550 zone.
  • There is a major bearish trend line forming with resistance near 1.2395 on the hourly chart.

GBP/USD Technical Analysis

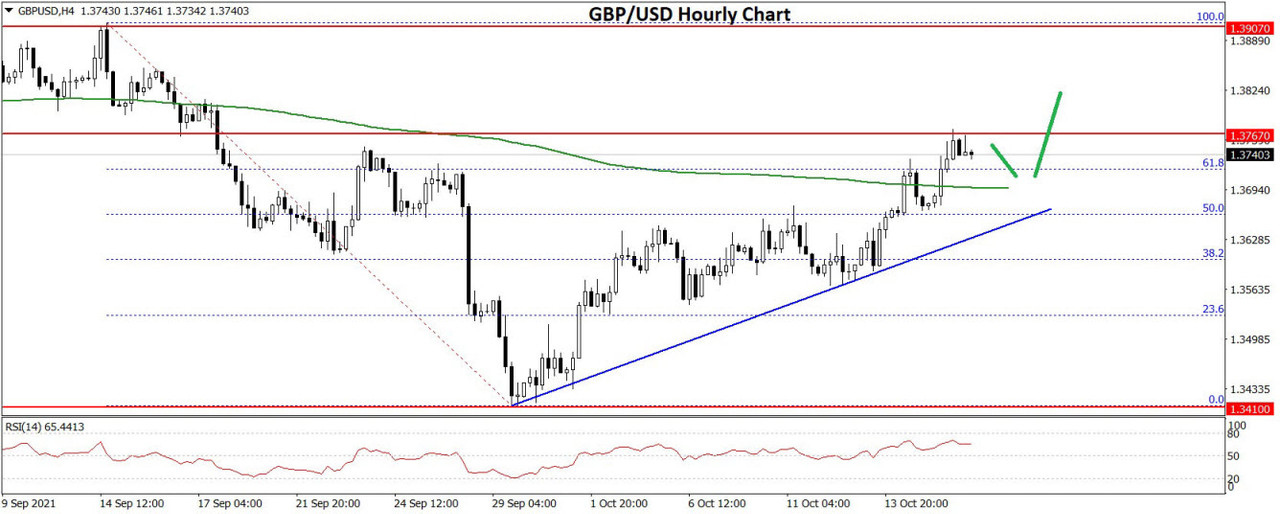
After a major decline, the British Pound found support above 1.2400 against the US Dollar. GBP/USD traded as low as 1.3410 and recently started an upside correction.

The pair broke the 1.3500 resistance to move into a positive zone. There was a break above the 50% Fib retracement level of the downward move from the 1.3907 swing high to 1.3410 low. It is now trading above the 1.3650 level and the 50 hourly simple moving average.

GBP/USD Hourly Chart


GBP/USD is now consolidating above the 1.3680 level. The pair is also trading above the 61.8% Fib retracement level of the downward move from the 1.3907 swing high (formed on FXOpen) to 1.3410 low.

An immediate resistance is near the 1.3770 level. The first major resistance is near the 1.3800 level. If there is an upside break above the 1.3800 zone, the pair could rise towards 1.3900. The next key resistance could be 1.3920, above which the pair could gain strength.

On the downside, the first key support is near the 1.3680 area. There is also a key bullish trend line forming with support near 1.3690 on the hourly chart of GBP/USD.

If there is a break below 1.3680, the pair could decline extend its decline. The next key support is near the 1.3620 level. Any more losses might call for a test of the 1.3550 support.

Read Full on FXOpen Company Blog...

850
Advertise Your Stuff / Re: FXOpen – FXOpen.com
« on: October 19, 2021, 08:08:56 PM »
FXOpen Cashback Program

FXOpen Cashback Program lets traders receive an additional refund for any kind of trades including loss-making. It is easy to get cashback: it is added to your Commission account that is open automatically, with no further actions. The cashback amount is determined in accordance with the total margin used on all client's trading accounts. The program is available for all types of FXOpen trading accounts: ECN, STP, Crypto, Micro, PAMM ECN, PAMM STP.

The 90-day Cashback program lets you receive an additional refund up to $1,000 for your trades. Available for all trading accounts


The advantages of FXOpen Cashback Program

  • Cashback amount can reach up to 150% of Standard commission per trade. It is one of the highest refunds among Forex brokers.
  • Cashback is fully automated. The funds are credited to the client's Commission account. They can be withdrawn or used for trading right after crediting.
  • The program is activated automatically at the time of registration with no additional requests. It is valid throughout the 90 days.

851
Advertise Your Stuff / FXOpen Broker
« on: October 19, 2021, 08:06:04 PM »
About FXOpen

FXOpen has been offering forex brokerage services since 2005. We are the first forex broker to offer our clients ECN trading via the MetaTrader 4 terminal. With FXOpen's unique proprietary price aggregating technology our clients can take advantage of the industry's most competitive spreads and low trading commissions.

Since the very start FXOpen has been true and loyal to its goal, making forex trading more professional, easy-to-access, and secure.

Take advantage of:

●   Some of the most competitive spreads - from 0.0 pips
●   Low commission from $1.50
●   Ultra-fast execution through our wide range of liquidity providers
●   600+ markets offered: FX and CFDs on Stocks, Indices, Commodities, Cryptocurrencies*, and ETFs
●   4 trading platforms - MetaTrader4, MetaTrader5, TickTrader, and TradingView
●   Trading accounts to suit every level of experience
●   Your choice of trading strategy
●   Latest economic news and professional market analyses

*At FXOpen UK and FXOpen AU, Cryptocurrency CFDs are only available for trading by those clients categorised as Professional clients under FCA Rules and Professional clients under ASIC Rules, respectively. They are not available for trading by Retail clients.

#fxopen #fxopenbroker

Disclaimer: This publication represents the News of the Companies operating under the FXOpen brand only (excluding FXOpen EU). It is not to be construed as an offer, solicitation, or recommendation with respect to products and services provided by the Companies operating under the FXOpen brand, nor is it to be considered financial advice.

RISK WARNING: Trading on the Forex market involves substantial risks, including complete possible loss of funds and other losses and is not suitable for all members. Clients should make an independent judgement as to whether trading is appropriate for them in the light of their financial condition, investment experience, risk tolerance and other factors.


Pages: 1 ... 55 56 [57]
ETH & ERC20 Tokens Donations: 0x2143F7146F0AadC0F9d85ea98F23273Da0e002Ab
BNB & BEP20 Tokens Donations: 0xcbDAB774B5659cB905d4db5487F9e2057b96147F
BTC Donations: bc1qjf99wr3dz9jn9fr43q28x0r50zeyxewcq8swng
BTC Tips for Moderators: 1Pz1S3d4Aiq7QE4m3MmuoUPEvKaAYbZRoG
Powered by SMFPacks Social Login Mod