- There was a sharp decline in bitcoin price after it spiked above the $9,000 level against the US Dollar.
- The price declined below the $8,600 support and tested the key $8,000 support area.
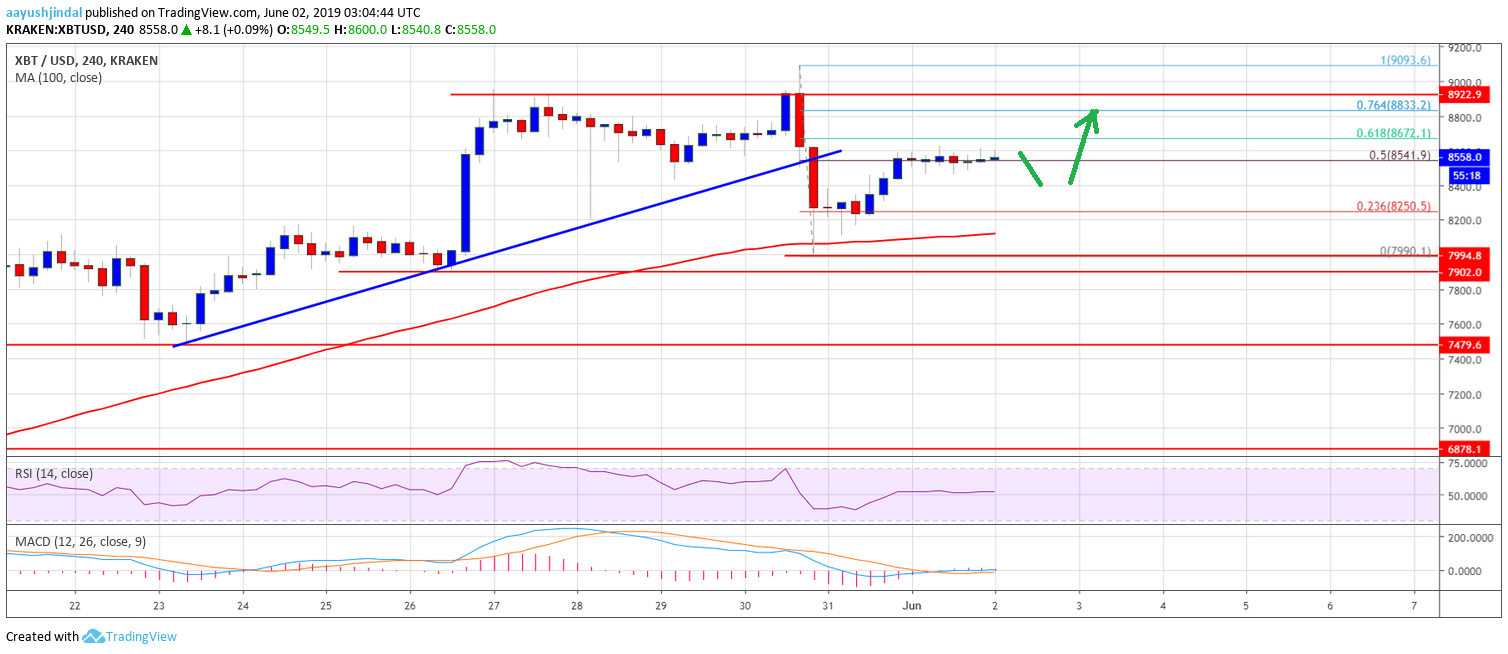
- There was a break below a major bullish trend line with support near $8,540 on the 4-hours chart of the BTC/USD pair (data feed
from Kraken).
- The pair tested the $8,000 support area ad recently bounced back above $8,400 and $8,500.
Bitcoin price recovered sharply after a major drop to $8,000 against the US Dollar. BTC is currently consolidating gains and it seems to be preparing for the next wave.
Bitcoin Price Weekly Analysis (BTC)This past week, bitcoin price remained in a positive zone and climbed above $8,800 against the US Dollar. The BTC/USD pair even broke the $9,000 resistance level and traded to a new 2019 high. A swing high was formed near $9,090, but the price failed to stay above the $9,000 level. As a result, there was a sharp decline below the $8,800 and $8,6000 support levels.
Moreover, there was a break below a major bullish trend line with support near $8,540 on the 4-hours chart of the BTC/USD pair. The decline was strong as the price even broke the $8,200 level. The price tested the key $8,000 support area and the 100 simple moving average (4-hours). It seems like the 100 simple moving average (4-hours) acted as a strong support near $8,000. The price bounced back above $8,400 and $8,500. There was a break above the 23.6% Fib retracement level of the recent decline from the $9,093 high to $7,990 swing low.
The price even traded a few points above the $8,600 level. At the moment, the price is consolidating near the 50% Fib retracement level of the recent decline from the $9,093 high to $7,990 swing low. On the upside, an initial resistance is near the $8,650. If there is a clear break above $8,650 and $8,700, the price is likely to gain bullish momentum.
 Technical indicators
4 hours MACD – The MACD for BTC/USD is slowly moving in the bullish zone.
4 hours RSI (Relative Strength Index) – The RSI for BTC/USD is currently above the level 50 and it could move higher.
Major Support Level – $8,400
Major Resistance Level – $8,700
source:
https://www.newsbtc.com/2019/06/02/bitcoin-btc-price-weekly-forecast-technical-bias-signaling-fresh-increase/


 Latest news:
  .
.  .
.  .
.  .
.  .
.  .
.  Shop
Shop

 Topic: Bitcoin (BTC) Price Weekly Forecast: Technical Bias Signaling Fresh Increase (Read 1364 times)