follow us on twitter . like us on facebook . follow us on instagram . subscribe to our youtube channel . announcements on telegram channel . ask urgent question ONLY . Subscribe to our reddit . Altcoins Talks Shop Shop


This is an Ad. Advertised sites are not endorsement by our Forum. They may be unsafe, untrustworthy, or illegal in your jurisdiction. Advertise Here Ads bidding Bidding Open

Show Posts

This section allows you to view all posts made by this member. Note that you can only see posts made in areas you currently have access to.


Topics - Quiks

Pages: [1]
1
Cryptocurrency Price Speculations / Price Analysis BTC/USD
« on: April 04, 2019, 11:00:13 AM »


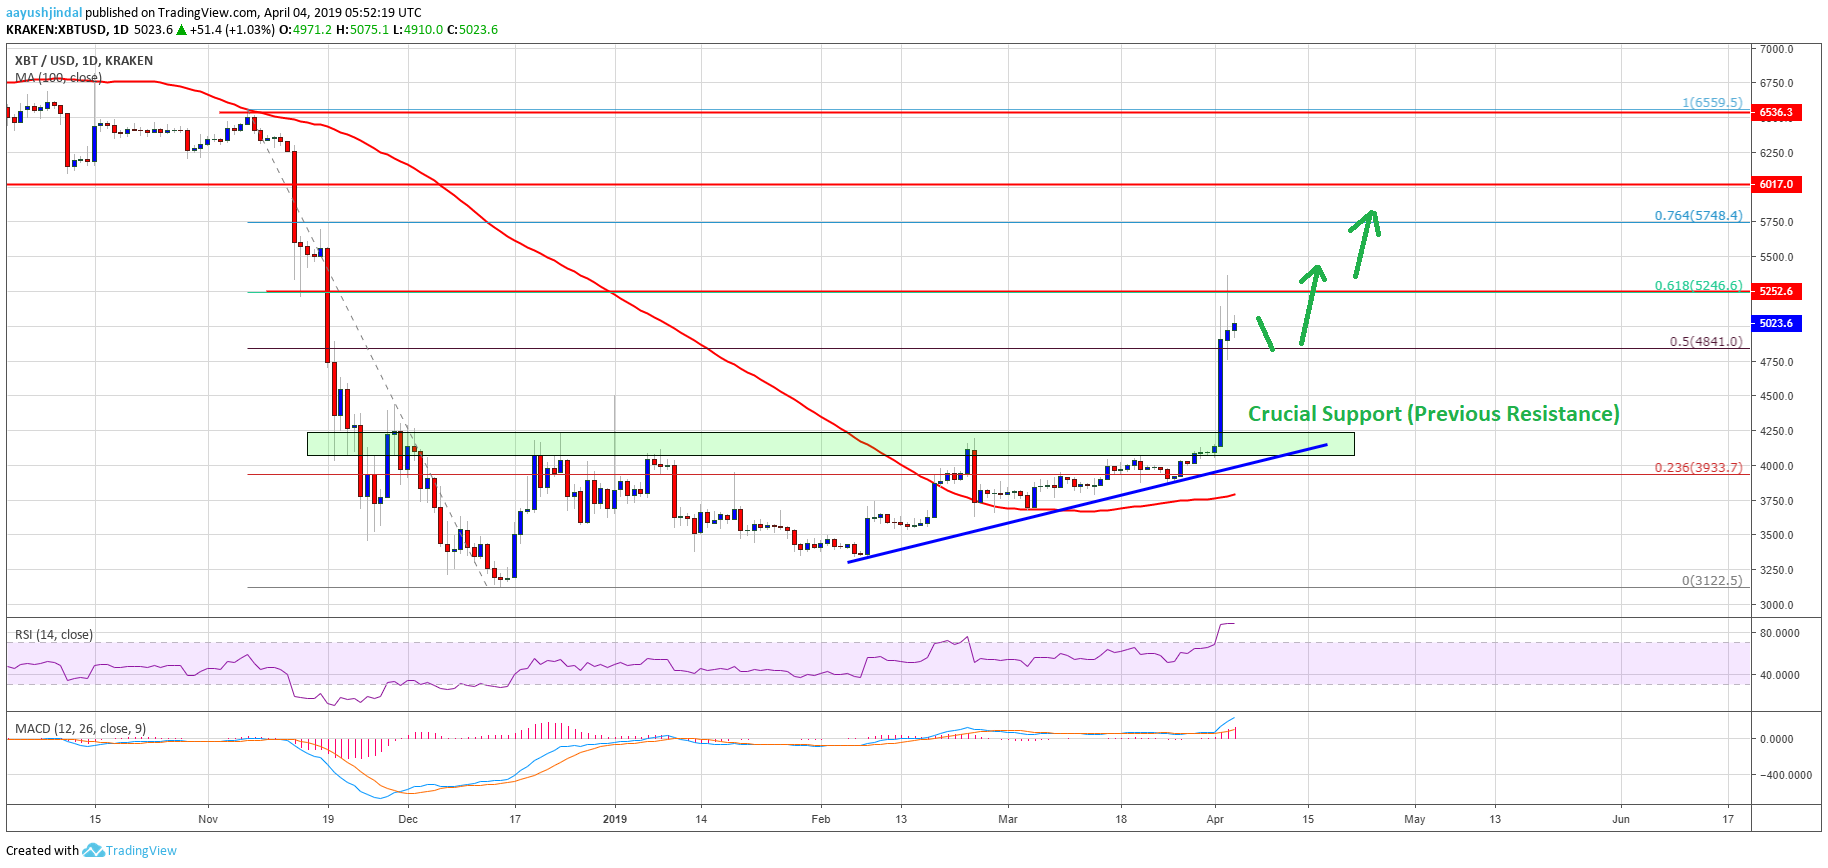
Bitcoin price settled above the key $5,000 hurdle and tested the $5,240 resistance against the US Dollar.

The price faced a strong selling interest near the main technical barrier at $5,240-5,260.
There is a major connecting bullish trend line formed with support near $4,200 on the daily chart of the BTC/USD pair (data feed from Kraken).
The pair corrected recently, but it is likely to make another breakout attempt above $5,240.
Bitcoin price started a massive bull-run above the $4,500 and $5,000 resistances against the US Dollar. BTC is currently struggling near the $5,240 resistance, but more upsides seems possible.

Bitcoin Price Analysis

In the past two days, we saw a nasty upward move above the $4,500 resistance in bitcoin price against the US Dollar. The BTC/USD pair even climbed above the $5,000 resistance and settled well above the 100-day simple moving average. During the recent rise, there was a break above a couple of important resistances near the $4,000 and $4,200 levels (green area). It opened the doors for a sharp rally above the $4,800 and $5,000 levels.

More importantly, there was a break above the 50% Fib retracement level of the last significant drop from the $6,559 high to $3,122 low. The price settled above the $5,000 resistance area and recently tested the next major hurdle near $5,240-5,260. It represents the previous swing low near $5,250 (red line). Besides, the 61.8% Fib retracement level of the last significant drop from the $6,559 high to $3,122 low is also near the $5,240 level. Therefore, the recent downside correction was from a crucial technical resistance near $5,250.

Having said that, downsides are likely to be limited since there are many supports near $5,000, $4,900 and $4,840. If there is an extended correction, the price could test the $4,600 or $4,550 support. There is also a major connecting bullish trend line formed with support near $4,200 on the daily chart of the BTC/USD pair. The main support is near the previous breakout area near the $4,200 level.

Bitcoin Price Analysis BTC Chart

Looking at the chart, bitcoin price clearly moved into a strong uptrend above $5,000. It is currently facing a crucial resistance near $5,240, above which there are chances of more upsides towards the $5,500 or $5,750 level. The final stop for buyers could be $6,000 if there is a proper follow through above $5,500. On the downside, buyers are likely to remain active near $4,840 or $4,600 in the near term.

Technical indicators:

Daily MACD – The MACD is placed heavily in the bullish zone.

Daily RSI (Relative Strength Index) – The RSI for BTC/USD climbed above the 80 level and currently flat near 87.

Major Support Levels – $4,840 followed by $4,600.  ;)

Major Resistance Levels – $5,250, $5,500 and $5,750.  ::)

2
XRP - Ripple Forum / Price Analysis:XRP/USD
« on: April 01, 2019, 10:05:10 AM »


Ripple price corrected lower after trading as high as $0.3168 against the US dollar.
The price traded below the $0.3100 level, but the $0.3070 level acted as a decent support.
There was a break above a key bearish trend line with resistance at $0.3080 on the hourly chart of the XRP/USD pair (data source from Kraken).
The pair is likely to accelerate gains once bulls clear the $0.3120 resistance level in the near term.
Ripple price remained well bids on the downside against the US Dollar and bitcoin. XRP/USD is climbing higher and it could accelerate once again towards the $0.3150 and $0.3165 levels.

Ripple Price Analysis

This past week, we saw a solid upward move above the $0.3100 resistance in ripple price against the US Dollar. The XRP/USD pair even broke the $0.3150 resistance and settled well above the 100 hourly simple moving average. The price traded as high as $0.3168 and later it started a downside correction. Sellers pushed the price below the $0.3120 and $0.3100 levels. However, the price found a strong support near the $0.3070 level and the 100 hourly simple moving average.

A swing low was formed at $0.3070 and recently the price climbed higher once again. It broke the 23.6% Fib retracement level of the last decline from the $0.3168 high to $0.3070 low. Moreover, there was a break above a key bearish trend line with resistance at $0.3080 on the hourly chart of the XRP/USD pair. The pair is now trading nicely above the $0.3080 level and the 100 hourly SMA. On the upside, an immediate resistance is near the $0.3120 level.

Besides, the 50% Fib retracement level of the last decline from the $0.3168 high to $0.3070 low is also near $0.3120. Therefore, the price might struggle to clear the $0.3120 resistance area. If bulls succeed in gaining strength above the $0.3120 resistance, the price could retest the $0.3150 resistance. Any further gains will most likely increase the chances of a move towards the $0.3200 barrier.

Ripple Price Analysis XRP Chart

Looking at the chart, ripple price is trading nicely above the $0.3070 support and the 100 hourly SMA. Should sellers clear the $0.3070 support, there could be a downside extension. The next key support is near the $0.3030 level, where buyers are likely to emerge. Therefore, the $0.3070 support holds the key for more gains above the $0.3100 and $0.3120 resistance levels in the near term.

Technical Indicators

Hourly MACD – The MACD for XRP/USD is gaining pace in the bullish zone.

Hourly RSI (Relative Strength Index) – The RSI for XRP/USD is currently well above the 50 level, with a positive bias.

Major Support Levels – $0.3080, $0.3070 and $0.3030. ;)

Major Resistance Levels – $0.3100, $0.3120 and $0.3150. :)

3


ETH price rallied in the past few days and broke the $139 and $144 resistances against the US Dollar.
The price is currently correcting lower, but it could find a strong support near the $139 zone.
There is a major ascending channel in place with support at $140 on the 4-hours chart of ETH/USD (data feed via Kraken).
The pair remains in an uptrend as long as there is no daily close below the $139 support zone.
Ethereum price is placed in a solid uptrend versus the US Dollar and Bitcoin. ETH/USD could test the $139 support area before it starts a fresh bullish wave above $144.

Ethereum Price Analysis

This past week, ETH price formed a solid support base near the $137 level against the US Dollar. The ETH/USD pair started a solid upside move and traded above the $139 and $142 resistance levels. There was a successful close above the $139 level and the 100 simple moving average (4-hours). It cleared the path for more gains and the price traded above the $144 resistance area. It traded close to the $146 resistance level and later started a substantial downside correction.

The price traded below the $142 level and the 50% Fib retracement level of the last wave from the $137 low to $145 swing high. However, the price found a strong buying interest above the key $139 support area. Moreover, there is a major ascending channel in place with support at $140 on the 4-hours chart of ETH/USD. The 61.8% Fib retracement level of the last wave from the $137 low to $145 swing high also acted as a support. The price recovered, but the $142 area is acting as a hurdle.

It seems like there could be another dip in ETH price below the $140 level. However, the $139 support zone is likely to act as a crucial buy zone. As long as there is no daily close below the $139 level, the price is likely to bounce back in the near term.

Ethereum Price Analysis ETH Chart

The above chart indicates that ETH price is clearly placed in an uptrend, but bulls need to prevent the $139 support area. On the upside, a break above the $142 and $144 levels is needed for more gains. The next key resistance is near $146, above which the price is likely to test the $150 resistance level.

Technical Indicators

4 hours MACD – The MACD for ETH/USD is slowly moving in the bearish zone, with a few negative signs.

4 hours RSI – The RSI for ETH/USD is currently correcting lower from the 75 level and it could test 55.

Major Support Level – $139

Major Resistance Level – $144

4


The total crypto market cap jumped to a new weekly high at $136.4B and later corrected lower.
EOS price rallied sharply and broke the $4.00 and $4.10 resistance levels.
Binance Coin (BNB) seems to be consolidating above the $16.50 and $16.20 support levels.
Bitcoin cash price gained nicely and it recently moved above the $170 resistance.
Tron (TRX) price is currently trading in a tight range above the $0.0230 support level.

The crypto market extended gains before starting a downside correction. Dips in bitcoin (BTC), Ethereum (ETH), binance coin (BNB), BCH, ripple, EOS, TRX and ADA remain supported.

Bitcoin Cash Price Analysis
Bitcoin cash price traded higher steadily after it cleared the $155 and $160 resistance levels against the US Dollar. The BCH/USD pair broke the $165 resistance and it slowly moved above the $170 level. The price is currently consolidating above the $170 level and it may continue to rise towards the $175 level.

On the other hand, if there is a downside correction, the price is likely to trade below the $170 and $168 support levels. The main support is $165, where buyers are likely to emerge.

EOS, Tron (TRX) and BNB Price Analysis
EOS price performed really well and climbed above the $4.00 barrier. Buyers were in full control and they succeeded in clearing the $4.10 and $4.20 resistance levels. The current price action is such that the price may even climb above the $4.30 resistance level in the coming sessions.

Tron price managed to stay above the $0.0220 and $0.0222 support levels. TRX price recently climbed above the $0.0230 resistance and traded above $0.0232. The next stop could be $0.0235. The main hurdle for buyers is near the $0.0240 level, where sellers might take a stand.

Binance coin (BNB) remained well bid after it broke the $16.00 resistance level. BNB price even spiked above the $17.00 level before starting a downside correction. The price is currently consolidating in a range, with an immediate support at $16.50. The main support on the downside is near the $16.00 level.

Crypto Market Cap Bitcoin Cash EOS BNB TRX

Looking at the total cryptocurrency market cap hourly chart, there was a solid upward move above the $130.0B and $132.5B resistance levels. The market cap even broke the $135.0B resistance and traded to a new weekly high at $136.4B. Later, it started a downside correction and moved below the $135.5B support and a bullish trend line on the same chart. However, there is a strong support on the downside near the $134.0B level. Therefore, if there is a downside correction in bitcoin, ETH, TRX, LTC, EOS, BNB, ripple, ADA, XLM, WAN, BCH, XMR and other altcoins, buyers are likely to take a stand.

5


Bitcoin is gaining momentum after a strong bounce off the rising channel support visible on the 1-hour chart. Price has climbed past the first two Fibonacci extension levels and could be looking to test the swing high next.

This is in line with the 61.8% Fibonacci extension level at $4,125. The channel resistance is closer to the 78.6% level at $4,177 and the full extension is at $4,242.3. However, 100 SMA is still below the longer-term 200 SMA to indicate that the path of least resistance is to the downside. In other words, there’s still a chance that bearish momentum could stay on.

Then again, the gap between the moving averages is narrowing to signal weakening selling pressure and a potential bullish crossover. If so, more buyers could be encouraged to jump in and sustain the climb. A break past the channel resistance could spur a steeper climb for Bitcoin.

RSI is heading lower from the overbought zone to signal that selling pressure is just about to pick up. Similarly stochastic has just recently turned lower from the overbought zone and has plenty of ground to cover before reaching the oversold region, which suggests that sellers could stay in the game for much longer. In that case, another test of the channel bottom around $4,000 could be underway, and a break below this might still spur a reversal.

The strong rebound off the $4,000 key area of interest seems to have been enough to revive confidence in the coin, as well as other cryptocurrencies. Many are still predicting that Bitcoin could reach as high as $5,500 in May when more developments kick in and central banks are rumored to be stocking up on digital assets as well.

However, this move seems to have been accompanied by low volumes and no actual industry developments, so profit-taking could be as quick as in previous instances.
 ;D ;D ;D

Pages: [1]
ETH & ERC20 Tokens Donations: 0x2143F7146F0AadC0F9d85ea98F23273Da0e002Ab
BNB & BEP20 Tokens Donations: 0xcbDAB774B5659cB905d4db5487F9e2057b96147F
BTC Donations: bc1qjf99wr3dz9jn9fr43q28x0r50zeyxewcq8swng
BTC Tips for Moderators: 1Pz1S3d4Aiq7QE4m3MmuoUPEvKaAYbZRoG
Powered by SMFPacks Social Login Mod