Latest news:


 Shop
Shop
 Bidding Open
1
Cryptocurrency Price Speculations / Re: Price Analysis BTC/USD
« on: May 15, 2019, 10:20:35 AM »
Bitcoin (BTC) Price Primed To Break $8.5K, Dips Remain Supported
Bitcoin price started a downside correction after trading close to $8,350 against the US Dollar.
The price declined below the $8,000 support and tested the $7,600-7,630 support area.
There is a short term bearish trend line forming with resistance near $8,100 on the hourly chart of the BTC/USD pair (data feed from Kraken).
The pair could retest the $7,600 support area before it could start a fresh increase above $8,200.
Bitcoin price corrected lower recently below $8,000 against the US Dollar. However, BTC remains well bid above $7,600 and it is likely to climb back above $8,200 and $8,300.
Bitcoin Price Analysis
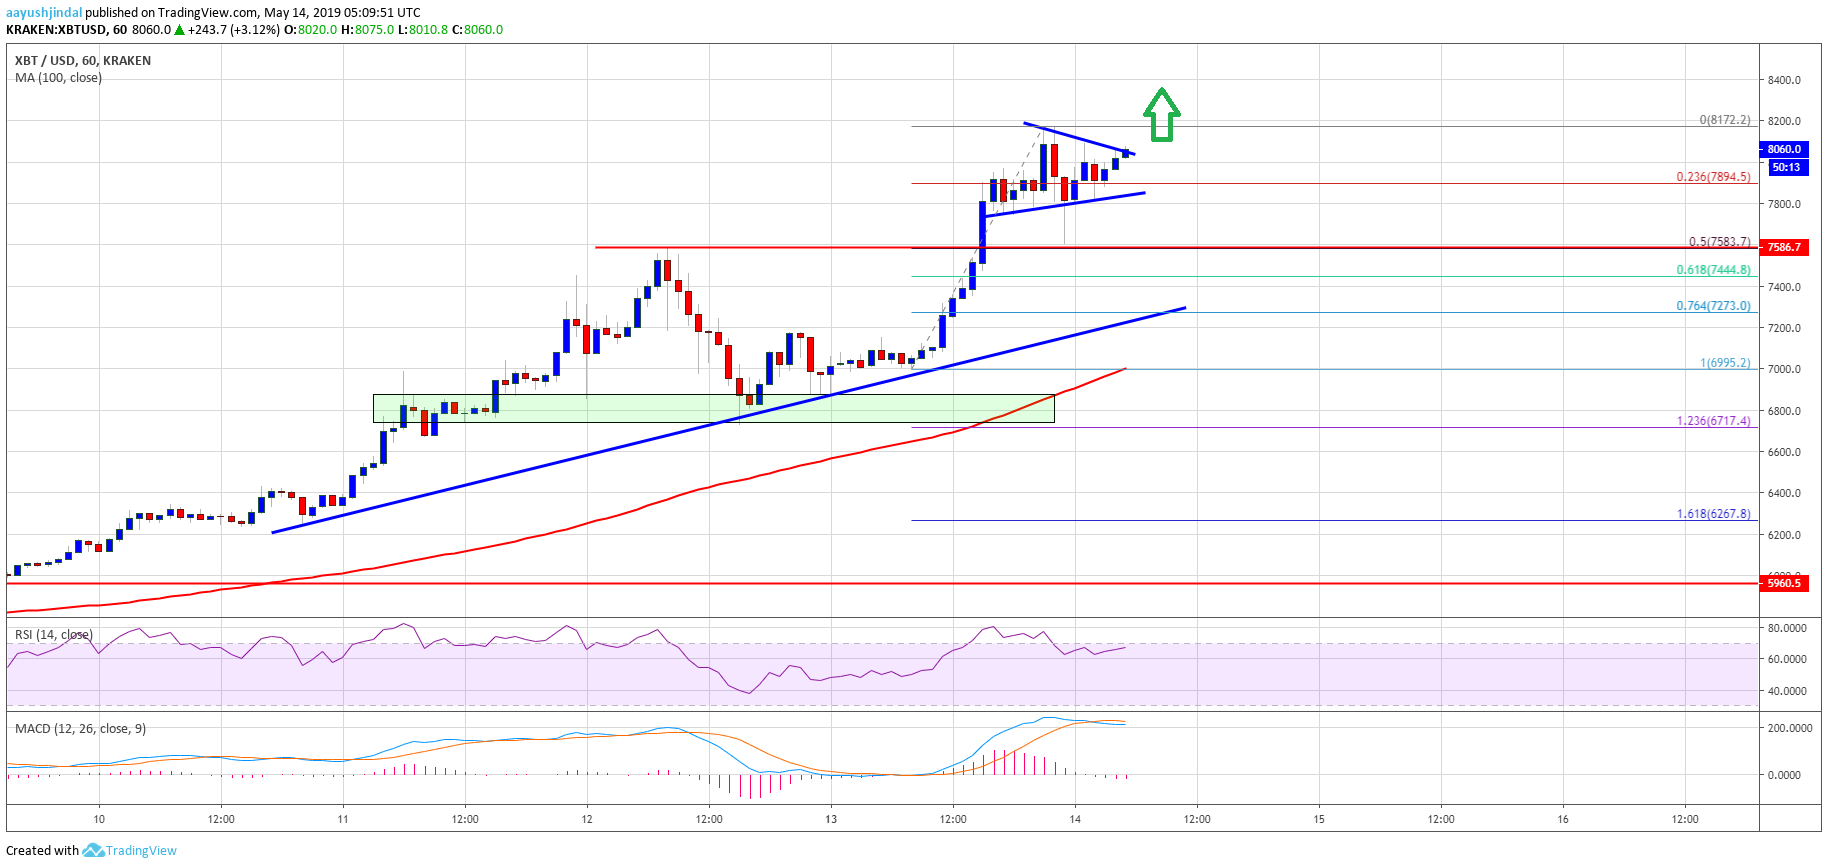
Yesterday, we saw an extended rally in bitcoin price above the $8,000 barrier against the US Dollar. The BTC/USD pair broke the $8,200 and $8,300 resistance levels. It traded close to the $8,340 level and a new 2019 high was formed at $8,338. Later, the price started a downside correction below the $8,200 support, but remained well above the 100 hourly simple moving average. The price declined below the $8,000 support level and traded close to the key $7,600 support area. A swing low was formed at $7,631 and the price recovered recently above $8,000.
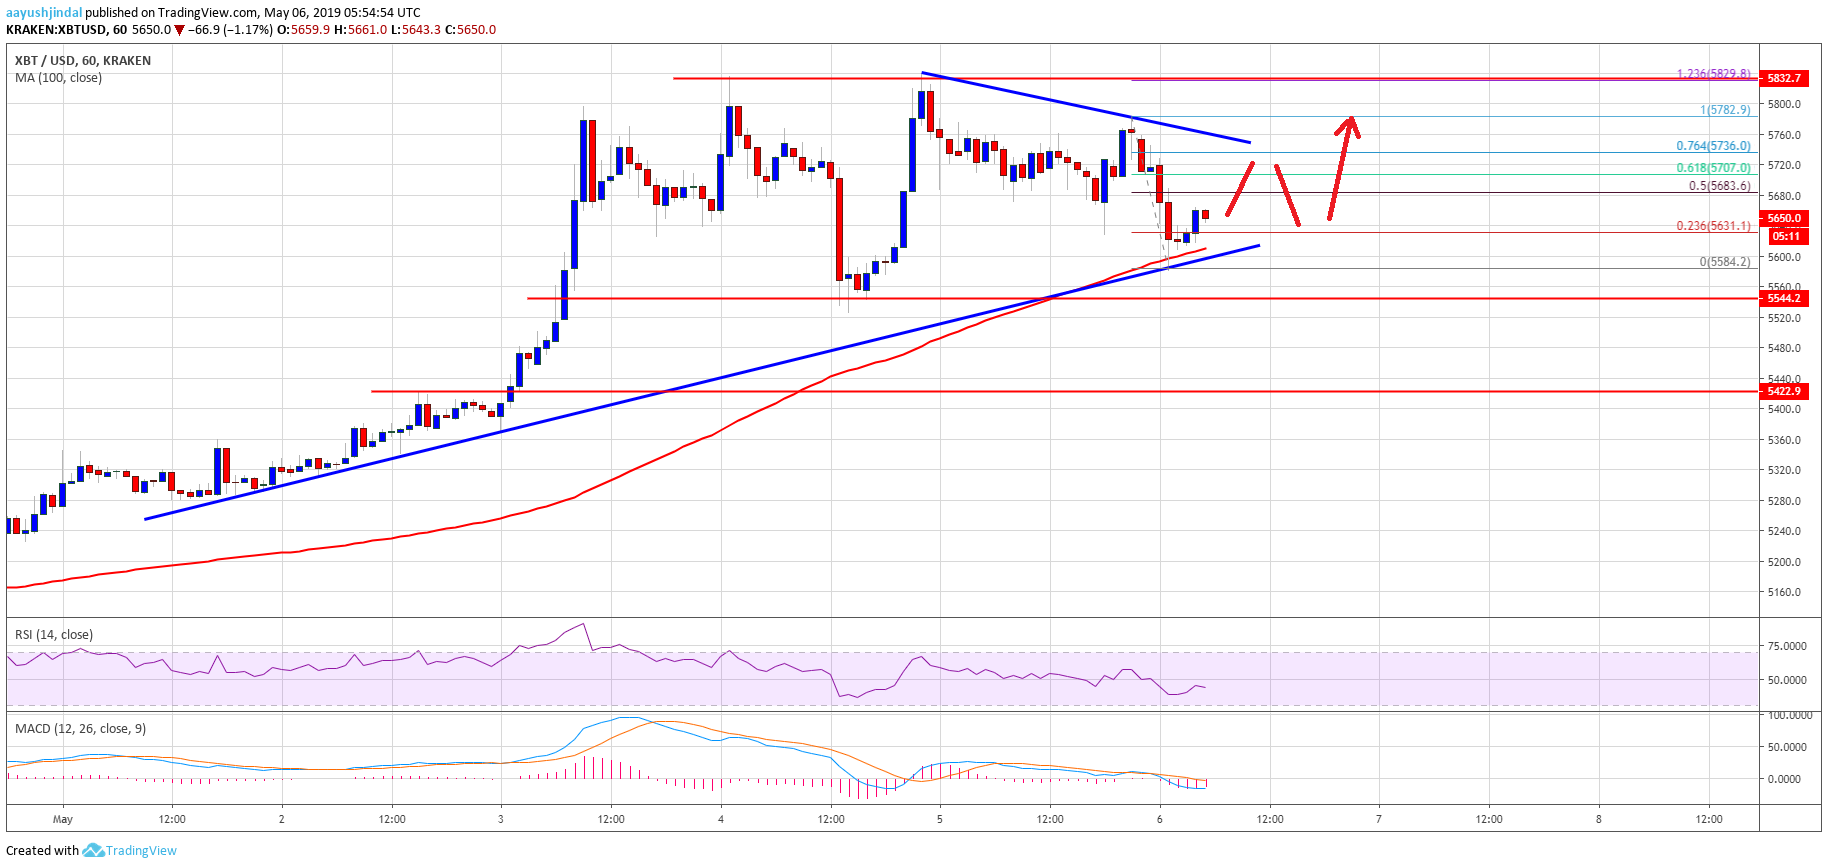
There was a break above the 50% Fib retracement level of the recent decline from the $8,338 high to $7,631 low. However, the price seems to be facing a strong resistance near $8,150. The 61.8% Fib retracement level of the recent decline from the $8,338 high to $7,631 low is also preventing an upside break. Moreover, there is a short term bearish trend line forming with resistance near $8,100 on the hourly chart of the BTC/USD pair. Therefore, the pair needs to clear the trend line and $8,150 to start a fresh increase.
On the upside, an immediate resistance above $8,150 is at $8,220. The next key resistance is near the $8,340 level, above which the price could test the $8,500 level. The 1.236 Fib extension level of the recent decline from the $8,338 high to $7,631 low is also near the $8,505 level.
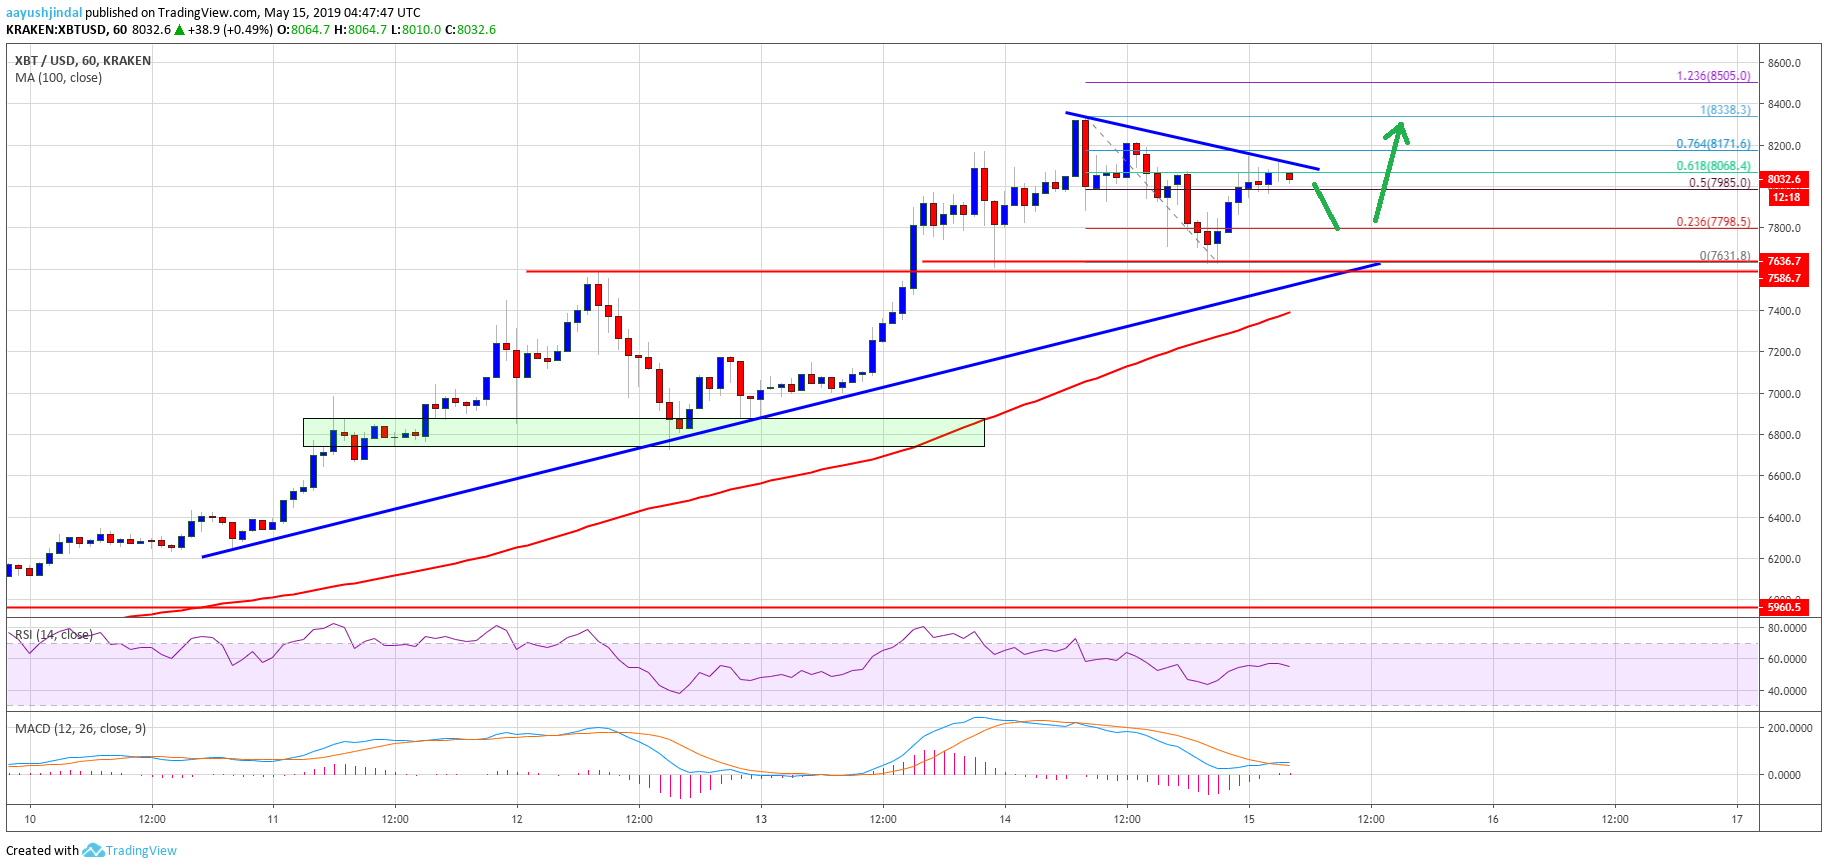
Bitcoin Price Analysis BTC Chart
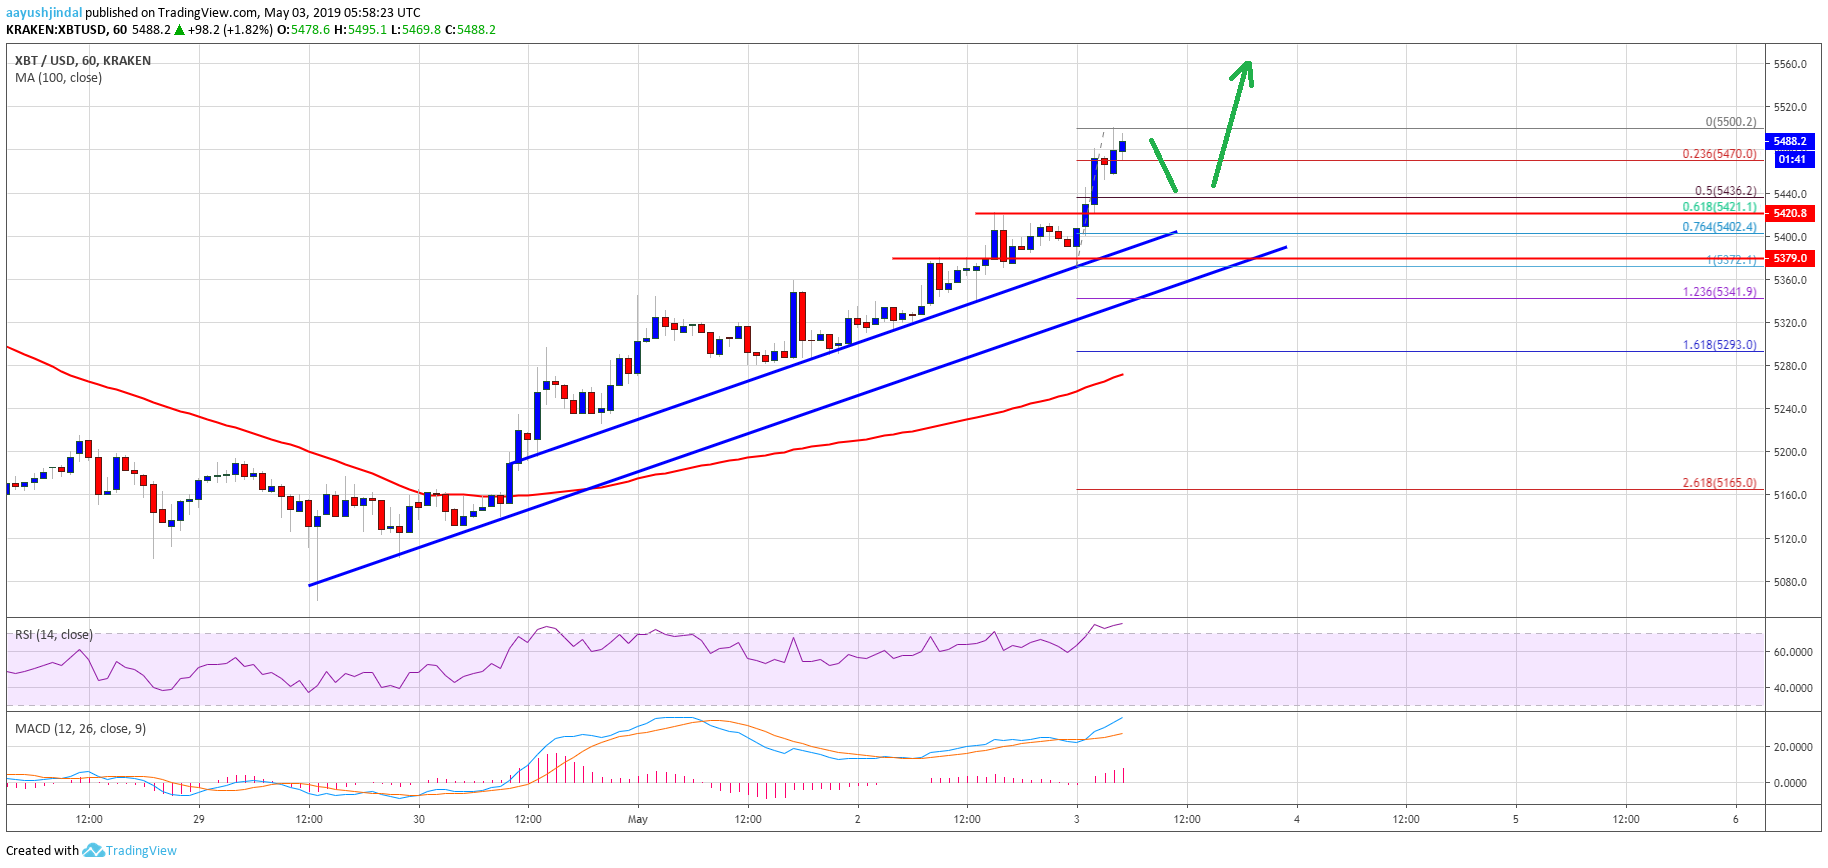
Looking at the chart, bitcoin price is currently consolidating above the $8,000 level. In the short term, there could be another drop towards $7,850 or even $7,630. However, there are many support on the downside near the $7,580 and $7,600 levels. Besides, this week’s followed important bullish trend line is intact with support at $7,580. As long as the price is above the trend line support, it is likely to break $8,150 and $8,340.
Technical indicators:
Hourly MACD – The MACD is likely to move back in the bullish zone
Hourly RSI (Relative Strength Index) – The RSI for BTC/USD is currently flat above the 50 level
Major Support Levels – $7,850 followed by $7,630
Major Resistance Levels – $8,100, $8,150 and $8,340
Bitcoin price started a downside correction after trading close to $8,350 against the US Dollar.
The price declined below the $8,000 support and tested the $7,600-7,630 support area.
There is a short term bearish trend line forming with resistance near $8,100 on the hourly chart of the BTC/USD pair (data feed from Kraken).
The pair could retest the $7,600 support area before it could start a fresh increase above $8,200.
Bitcoin price corrected lower recently below $8,000 against the US Dollar. However, BTC remains well bid above $7,600 and it is likely to climb back above $8,200 and $8,300.
Bitcoin Price Analysis
Yesterday, we saw an extended rally in bitcoin price above the $8,000 barrier against the US Dollar. The BTC/USD pair broke the $8,200 and $8,300 resistance levels. It traded close to the $8,340 level and a new 2019 high was formed at $8,338. Later, the price started a downside correction below the $8,200 support, but remained well above the 100 hourly simple moving average. The price declined below the $8,000 support level and traded close to the key $7,600 support area. A swing low was formed at $7,631 and the price recovered recently above $8,000.
There was a break above the 50% Fib retracement level of the recent decline from the $8,338 high to $7,631 low. However, the price seems to be facing a strong resistance near $8,150. The 61.8% Fib retracement level of the recent decline from the $8,338 high to $7,631 low is also preventing an upside break. Moreover, there is a short term bearish trend line forming with resistance near $8,100 on the hourly chart of the BTC/USD pair. Therefore, the pair needs to clear the trend line and $8,150 to start a fresh increase.
On the upside, an immediate resistance above $8,150 is at $8,220. The next key resistance is near the $8,340 level, above which the price could test the $8,500 level. The 1.236 Fib extension level of the recent decline from the $8,338 high to $7,631 low is also near the $8,505 level.
Bitcoin Price Analysis BTC Chart
Looking at the chart, bitcoin price is currently consolidating above the $8,000 level. In the short term, there could be another drop towards $7,850 or even $7,630. However, there are many support on the downside near the $7,580 and $7,600 levels. Besides, this week’s followed important bullish trend line is intact with support at $7,580. As long as the price is above the trend line support, it is likely to break $8,150 and $8,340.
Technical indicators:
Hourly MACD – The MACD is likely to move back in the bullish zone
Hourly RSI (Relative Strength Index) – The RSI for BTC/USD is currently flat above the 50 level
Major Support Levels – $7,850 followed by $7,630
Major Resistance Levels – $8,100, $8,150 and $8,340