follow us on twitter . like us on facebook . follow us on instagram . subscribe to our youtube channel . announcements on telegram channel . ask urgent question ONLY . Subscribe to our reddit . Altcoins Talks Shop Shop


This is an Ad. Advertised sites are not endorsement by our Forum. They may be unsafe, untrustworthy, or illegal in your jurisdiction. Advertise Here Ads bidding Bidding Open

Author Topic: Price Analysis:XRP/USD  (Read 21125 times)

Offline Quiks

  • Baby Steps
  • *
  • Activity: 28
  • points:
    100
  • Karma: -1
  • Bitcoin - will save the world!
  • Trade Count: (0)
  • Referrals: 0
  • Last Active: May 18, 2019, 04:34:10 PM
    • View Profile

  • Total Badges: 10
    Badges: (View All)
    10 Posts First Post Fourth year Anniversary
Price Analysis:XRP/USD
« on: April 01, 2019, 10:05:10 AM »


Ripple price corrected lower after trading as high as $0.3168 against the US dollar.
The price traded below the $0.3100 level, but the $0.3070 level acted as a decent support.
There was a break above a key bearish trend line with resistance at $0.3080 on the hourly chart of the XRP/USD pair (data source from Kraken).
The pair is likely to accelerate gains once bulls clear the $0.3120 resistance level in the near term.
Ripple price remained well bids on the downside against the US Dollar and bitcoin. XRP/USD is climbing higher and it could accelerate once again towards the $0.3150 and $0.3165 levels.

Ripple Price Analysis

This past week, we saw a solid upward move above the $0.3100 resistance in ripple price against the US Dollar. The XRP/USD pair even broke the $0.3150 resistance and settled well above the 100 hourly simple moving average. The price traded as high as $0.3168 and later it started a downside correction. Sellers pushed the price below the $0.3120 and $0.3100 levels. However, the price found a strong support near the $0.3070 level and the 100 hourly simple moving average.

A swing low was formed at $0.3070 and recently the price climbed higher once again. It broke the 23.6% Fib retracement level of the last decline from the $0.3168 high to $0.3070 low. Moreover, there was a break above a key bearish trend line with resistance at $0.3080 on the hourly chart of the XRP/USD pair. The pair is now trading nicely above the $0.3080 level and the 100 hourly SMA. On the upside, an immediate resistance is near the $0.3120 level.

Besides, the 50% Fib retracement level of the last decline from the $0.3168 high to $0.3070 low is also near $0.3120. Therefore, the price might struggle to clear the $0.3120 resistance area. If bulls succeed in gaining strength above the $0.3120 resistance, the price could retest the $0.3150 resistance. Any further gains will most likely increase the chances of a move towards the $0.3200 barrier.

Ripple Price Analysis XRP Chart

Looking at the chart, ripple price is trading nicely above the $0.3070 support and the 100 hourly SMA. Should sellers clear the $0.3070 support, there could be a downside extension. The next key support is near the $0.3030 level, where buyers are likely to emerge. Therefore, the $0.3070 support holds the key for more gains above the $0.3100 and $0.3120 resistance levels in the near term.

Technical Indicators

Hourly MACD – The MACD for XRP/USD is gaining pace in the bullish zone.

Hourly RSI (Relative Strength Index) – The RSI for XRP/USD is currently well above the 50 level, with a positive bias.

Major Support Levels – $0.3080, $0.3070 and $0.3030. ;)

Major Resistance Levels – $0.3100, $0.3120 and $0.3150. :)
Сrypto trader. Where I trade I will not tell)

Altcoins Talks - Cryptocurrency Forum

Price Analysis:XRP/USD
« on: April 01, 2019, 10:05:10 AM »

This is an Ad. Advertised sites are not endorsement by our Forum. They may be unsafe, untrustworthy, or illegal in your jurisdiction. Advertise Here Ads bidding Bidding Open


Offline Quiks

  • Baby Steps
  • *
  • Activity: 28
  • points:
    100
  • Karma: -1
  • Bitcoin - will save the world!
  • Trade Count: (0)
  • Referrals: 0
  • Last Active: May 18, 2019, 04:34:10 PM
    • View Profile

  • Total Badges: 10
    Badges: (View All)
    10 Posts First Post Fourth year Anniversary
Re: Price Analysis:XRP/USD
« Reply #1 on: April 05, 2019, 09:31:05 AM »
Price Analysis : XRP/USD


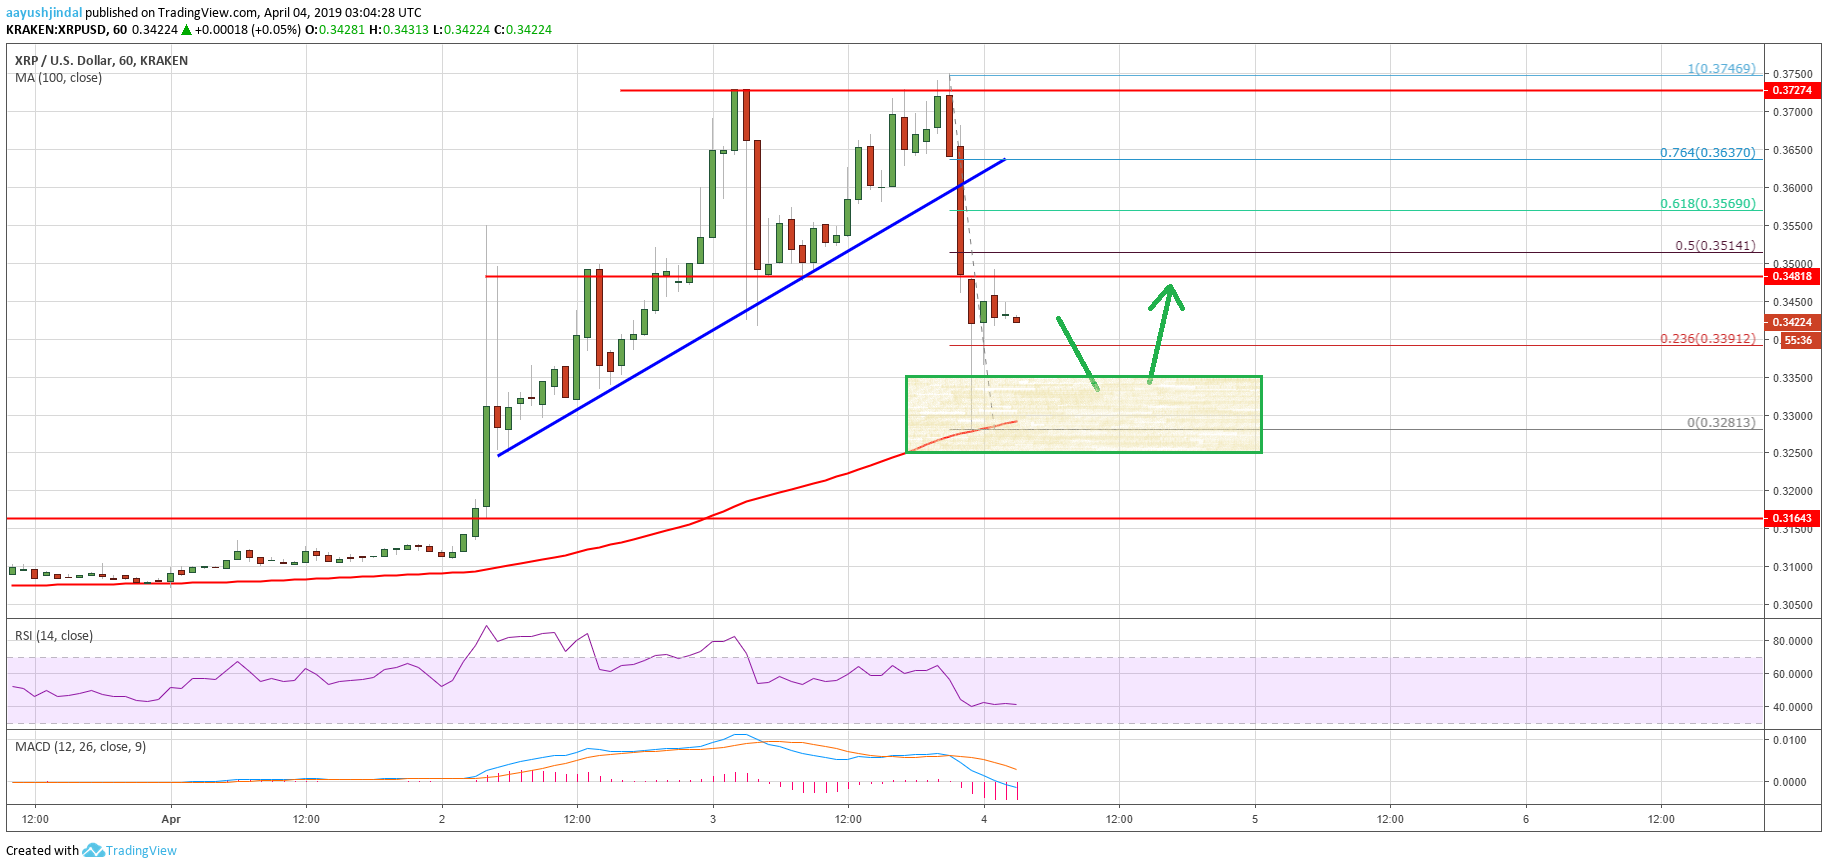
Ripple price climbed sharply and tested the $0.3750 resistance before correcting lower against the US dollar.
The price corrected below the $0.3600 and $0.3480 support before buyers appeared near $0.3280.
Yesterday’s highlighted important bullish trend line was breached with support at $0.3600 on the hourly chart of the XRP/USD pair (data source from Kraken).
The pair must stay above the $0.3300 support and the 100 hourly SMA to bounce back.
Ripple price corrected lower sharply after a strong rise against the US Dollar and bitcoin. XRP tested a crucial support area and it remains well bid on the downside above $0.3300.

Ripple Price Analysis

There was a strong upward move above the $0.3480 resistance in ripple price against the US Dollar. The XRP/USD pair surged above the $0.3500 and $0.3600 resistance levels. The price traded close to the $0.3750 resistance and settled well above the 100 hourly simple moving average. Later, there was a downside correction, but the $0.3480 support acted as a buy zone. There was a fresh increase, but the price failed again near the $0.3750 resistance area.

As a result, there was a sharp decline below the $0.3600 and $0.3480 support level. Moreover, yesterday’s highlighted important bullish trend line was breached with support at $0.3600 on the hourly chart of the XRP/USD pair. The decline was such that the price even spiked below the $0.3400 level. It tested the $0.3280 support area and the 100 hourly simple moving average. A strong buying interest emerged near $0.3280, resulting in a rebound above $0.3400. The price broke the 23.6% Fib retracement level of the recent decline from the $0.3746 high to $0.3281 low.
However, the previous key support near $0.3480 is currently acting as a strong resistance. The next key resistance is near the $0.3500-0.3510 area. Besides, the 50% Fib retracement level of the recent decline from the $0.3746 high to $0.3281 low is also near the $0.3510 level. Therefore, a break above the $0.3510 level is needed for buyers to regain control in the near term.

Ripple Price Analysis XRP Chart

Looking at the chart, ripple price could decline once again towards the $0.3300 support and the 100 hourly SMA. However, downsides could be contained as the price is likely to bounce back as long as it is above $0.3280 and the 100 hourly SMA. If there is a close below the 100 hourly SMA, the price might slide back towards the $0.3000 support area.

Technical Indicators

Hourly MACD – The MACD for XRP/USD is gaining momentum in the bearish zone.
Hourly RSI (Relative Strength Index) – The RSI for XRP/USD declined sharply below the 50 level and it is currently near 40.
Major Support Levels – $0.3320, $0.3300 and $0.3280.  :o
Major Resistance Levels – $0.3480, $0.3500 and $0.3510.  ::)
Сrypto trader. Where I trade I will not tell)

Offline Quiks

  • Baby Steps
  • *
  • Activity: 28
  • points:
    100
  • Karma: -1
  • Bitcoin - will save the world!
  • Trade Count: (0)
  • Referrals: 0
  • Last Active: May 18, 2019, 04:34:10 PM
    • View Profile

  • Total Badges: 10
    Badges: (View All)
    10 Posts First Post Fourth year Anniversary
Re: Price Analysis:XRP/USD
« Reply #2 on: April 08, 2019, 08:38:17 AM »
Ripple (XRP) Price Could Soon Follow BTC and ETH Higher, Targets $0.40


Ripple price is trading in a positive zone above the $0.3500 support area against the US dollar.
Bitcoin and Ethereum climbed higher recently above the $5,200 and $180 levels respectively.
There was a break above a short-term contracting triangle with resistance near $0.3620 on the hourly chart of the XRP/USD pair (data source from Kraken).
The pair must clear the $0.3750 resistance to climb towards the $0.3850 and $0.4000 resistances.
Ripple price is placed nicely for more gains against the US Dollar and bitcoin. XRP might sooner or later break the $0.3750 resistance to start a solid rise towards the $0.4000 level.

Ripple Price Analysis

After a downside correction, ripple price found support near the $0.3250 level against the US Dollar. The XRP/USD pair started a fresh rise and traded above the $0.3380 and $0.3400 resistance levels. Later, there was a close above the $0.3500 level and the 100 hourly simple moving average. A swing high was formed at $0.3791 before the price corrected once again. It declined below the $0.3600 level and the 50% Fib retracement level of the last wave from the $0.3258 low to $0.3791 high.

However, the $0.3500 level acted as a solid support along with the 100 hourly SMA. Besides, the 61.8% Fib retracement level of the last wave from the $0.3258 low to $0.3791 high also acted as a support. The price is currently moving higher and is placed above the $0.3600 level. Moreover, there was a break above a short-term contracting triangle with resistance near $0.3620 on the hourly chart of the XRP/USD pair. The pair tested the $0.3700 level and it is currently signaling more gains.

On the upside, the main resistance is near the $0.3750 and $0.3780 levels. A successful close above the $0.3750 level is likely to open the doors for more gains above the $0.3850 resistance. The next main hurdle for buyers is near the $0.4000 level, where sellers are likely to appear.

Ripple Price Analysis XRP Chart

Looking at the chart, ripple price is clearly trading in a bullish zone above the $0.3600 and $0.3550 support levels. Therefore, if there is a fresh downside correction, buyers are likely to protect $0.3550 and the 100 hourly SMA. On the upside, sellers need to keep an eye on $0.3750 and $0.3780. A successful follow through above $0.3780 and $0.3800 is likely to push the price towards the $0.3850, $0.3900 or even $0.4000.

Technical Indicators

Hourly MACD – The MACD for XRP/USD is placed nicely in the bullish zone.

Hourly RSI (Relative Strength Index) – The RSI for XRP/USD is currently correcting lower towards the 50 level.

Major Support Levels – $0.3600, $0.3550 and $0.3520. ;D

Major Resistance Levels – $0.3700, $0.3750 and $0.3780. ::)
Сrypto trader. Where I trade I will not tell)

Offline Quiks

  • Baby Steps
  • *
  • Activity: 28
  • points:
    100
  • Karma: -1
  • Bitcoin - will save the world!
  • Trade Count: (0)
  • Referrals: 0
  • Last Active: May 18, 2019, 04:34:10 PM
    • View Profile

  • Total Badges: 10
    Badges: (View All)
    10 Posts First Post Fourth year Anniversary
Re: Price Analysis:XRP/USD
« Reply #3 on: April 16, 2019, 10:19:08 AM »
Ripple (XRP) Price Could Retest $0.3000 Before Fresh Upside


Ripple price failed near the $0.3370 level and declined below the $0.3250 support against the US dollar.
The price traded to a new weekly low at $0.3134 and remains at a risk of more losses in the short term.
There is a major bearish trend line formed with resistance near $0.3285 on the hourly chart of the XRP/USD pair (data source from Kraken).
The pair could extend the current decline and it may even revisit the key $0.3000 support area.
Ripple price failed to gain bullish momentum against the US Dollar and bitcoin. XRP declined below $0.3220 and it may continue to decline towards $0.3000 before completing a correction.

Ripple Price Analysis

Yesterday, we saw a strong buying interest above $0.3200 and ripple price recovered above $0.3280 against the US Dollar. The XRP/USD pair even broke the $0.3350 level, but it failed to clear the $0.3370 level. It seems like the price struggled to settle above the $0.3350 level and the 100 hourly simple moving average. As a result, there was a fresh decline below $0.3280 and $0.3250. The price even broke the $0.3220 and $0.3200 support levels. A new weekly low was formed at $0.3134 and the price settled well below the 100 hourly simple moving average.

At the moment, the price is correcting higher above $0.3150. It broke the 23.6% Fib retracement level of the recent decline from the $0.3326 high to $0.3134 low. However, there are many resistances on the upside, starting with $0.3220 and $0.3230. The 50% Fib retracement level of the recent decline from the $0.3326 high to $0.3134 low is also near $0.3230. Above $0.3230, the 100 hourly SMA could prevent gains above $0.3250. There is also a major bearish trend line formed with resistance near $0.3285 on the hourly chart of the XRP/USD pair.

Therefore, the price is likely to struggle between $0.3250 and $0.3280 in the short term. If bulls fail to surpass the trend line and $0.3300, there are chances of a fresh decline. An initial support is near the recent low at $0.3130, below which the price may revisit the $0.3100 level. However, the main support is at $0.3000, where buyers are likely to appear.

Ripple Price Analysis XRP Chart

Looking at the chart, ripple price is showing bearish signs below the $0.3250 and $0.3280 levels. A clear break and close above $0.3300 is needed for a change in trend to bullish in the near term.

Technical Indicators

Hourly MACD – The MACD for XRP/USD might move back in the bullish zone.
Hourly RSI (Relative Strength Index) – The RSI for XRP/USD recovered recently from 25 and it is currently at 40.
Major Support Levels – $0.3130, $0.3100 and $0.3000.  :o
Major Resistance Levels – $0.3250, $0.3280 and $0.3300.  ;)
Сrypto trader. Where I trade I will not tell)

Offline RaimondRandom

  • Baby Steps
  • *
  • Activity: 9
  • points:
    72
  • Karma: 0
  • Trade Count: (0)
  • Referrals: 0
  • Last Active: May 06, 2019, 05:50:44 PM
    • View Profile

  • Total Badges: 5
    Badges: (View All)
    First Post Fourth year Anniversary Third year Anniversary
Re: Price Analysis:XRP/USD
« Reply #4 on: April 16, 2019, 01:02:22 PM »
As for me - dump is more likely

Offline Sudarmono

  • Plagiarism strike
  • Sr. Member
  • *
  • Activity: 646
  • points:
    1001
  • Karma: -2
  • 🔰 FERRUM NETWORK
  • Trade Count: (0)
  • Referrals: 4
  • Last Active: December 20, 2020, 03:12:44 AM
    • View Profile

  • Total Badges: 16
    Badges: (View All)
    10 Posts First Post Fifth year Anniversary
Re: Price Analysis:XRP/USD
« Reply #5 on: April 21, 2019, 03:10:53 AM »
it's a very low price and it's very good to buy, and believe that the ripples will soon experience a very good price increase in the future.
Ferrum Network •   ANN • Bounty • Website • Telegram
The First High-Speed Interoperability Network for Real-World Financial Applications

Offline Quiks

  • Baby Steps
  • *
  • Activity: 28
  • points:
    100
  • Karma: -1
  • Bitcoin - will save the world!
  • Trade Count: (0)
  • Referrals: 0
  • Last Active: May 18, 2019, 04:34:10 PM
    • View Profile

  • Total Badges: 10
    Badges: (View All)
    10 Posts First Post Fourth year Anniversary
Re: Price Analysis:XRP/USD
« Reply #6 on: April 29, 2019, 09:52:26 AM »
Ripple (XRP) Price Remains At Risk Of Further Decline


Ripple price recovered recently above the $0.2900 level and tested $0.2960 against the US dollar.
The price seems to be facing a strong resistance near the $0.2950 and $0.2960 resistance levels.
There is a connecting bearish trend line forming with resistance near $0.2935 on the hourly chart of the XRP/USD pair (data source from Kraken).
The pair could revisit the $0.2810 level as long as it is trading below $0.2960 and $0.3000.
Ripple price is facing a lot of hurdles on the upside against the US Dollar and bitcoin. XRP remains at a risk of more declines unless it climbs back above the $0.3000 resistance area.

Ripple Price Analysis

After a short term correction, ripple price extended losses below the $0.2950 support against the US Dollar. The XRP/USD pair broke the $0.2920 support level and declined heavily below $0.2900. It traded close to the $0.2800 level and settled well below the 100 hourly simple moving average. A new monthly low was formed at $0.2796 and the price recently corrected higher. It broke the $0.2860 level and the 23.6% Fib retracement level of the last drop from the $0.3077 high to $0.2796 low.

The price even moved above the $0.2900 level, but it faced a strong resistance near the $0.2950 and $0.2960 resistance levels. More importantly, the price failed to clear the 100 hourly simple moving average, which is currently near $0.2938. Besides, the price failed near the 50% Fib retracement level of the last drop from the $0.3077 high to $0.2796 low. Finally, there is also a connecting bearish trend line forming with resistance near $0.2935 on the hourly chart of the XRP/USD pair.

Therefore, ripple must break the $0.2950 resistance, the trend line, and the 100 hourly SMA. A successful close above the $0.2950-0.2960 zone could push the price towards the next resistance at $0.3000. Once there is a daily close above $0.3000, the price may start a decent recovery in the near term. On the downside, an initial support is near the $0.2860 level. If the bulls struggle to keep the price above $0.2860, the price could revisit the $0.2810 and $0.2800 support levels.

Ripple Price Analysis XRP Chart

Looking at the chart, ripple price is clearly trading in a tight range below key resistances near $0.2960 and $0.3000. The bulls need to gain traction above $0.3000 to push the price back in a positive zone. If not, there is a risk of a fresh decline towards the $0.2810 or $0.2750 level.

Technical Indicators

Hourly MACD – The MACD for XRP/USD is likely to remain in the bearish zone.
Hourly RSI (Relative Strength Index) – The RSI for XRP/USD recently jumped above the 50 level.
Major Support Levels – $0.2860, $0.2810 and $0.2800.  :)
Major Resistance Levels – $0.2950, $0.2960 and $0.3000.   ;)
Сrypto trader. Where I trade I will not tell)

Altcoins Talks - Cryptocurrency Forum

Re: Price Analysis:XRP/USD
« Reply #6 on: April 29, 2019, 09:52:26 AM »


Offline bubblebubble

  • Sr. Member
  • *
  • Activity: 528
  • points:
    770
  • Karma: 7
  • Stake & Vote or Become a IoTeX Delegate!
  • Trade Count: (0)
  • Referrals: 2
  • Last Active: August 14, 2019, 10:54:47 AM
    • View Profile

  • Total Badges: 22
    Badges: (View All)
    10 Posts First Post Fifth year Anniversary
Re: Price Analysis:XRP/USD
« Reply #7 on: April 30, 2019, 07:55:27 AM »
I did a big entry to the support of 0.30 $ and now we are below. And this worries me because it could goes down more if Bitcoin breaks own support and return in bear trend.


IoTeX


▬▬INTERNET OF TRUSTED THINGS▬▬
▬▬▬▬▬▬▬▬▬▬▬▬▬▬▬▬▬▬▬▬▬▬.
▬▬▬BECOME A MEMBER TODAY▬▬▬▬.


TWITTER
MEDIUM
REDDIT
TELEGRAM
FORUM
ALTCOINSTALKS

Offline Quiks

  • Baby Steps
  • *
  • Activity: 28
  • points:
    100
  • Karma: -1
  • Bitcoin - will save the world!
  • Trade Count: (0)
  • Referrals: 0
  • Last Active: May 18, 2019, 04:34:10 PM
    • View Profile

  • Total Badges: 10
    Badges: (View All)
    10 Posts First Post Fourth year Anniversary
Re: Price Analysis:XRP/USD
« Reply #8 on: May 02, 2019, 09:45:17 AM »
Ripple (XRP) Price Holding Key Support: Fresh Upside In Play


Ripple price traded towards the $0.3080 level and recently corrected lower against the US dollar.
The price traded lower and broke the $0.3040 and $0.3020 support levels.
There is a key bullish trend line in place with support near $0.2965 on the hourly chart of the XRP/USD pair (data source from Kraken).
The pair could dips a few points, but it is likely to bounce back as long as it is above $0.2950
Ripple price is trading with a positive bias above key supports against the US Dollar, but struggling vs bitcoin. XRP could bounce back as long as it is holding the $0.2950 support.

Ripple Price Analysis

Yesterday, we saw a nice upward move in ripple price above the $0.2950 and $0.3000 resistances against the US Dollar. The XRP/USD pair gained traction and broke the $0.3050 level as well and settled above the 100 hourly simple moving average. It traded close to the $0.3090 level and formed a new swing high near $0.3088. Later, it started a downside correction and traded below the $0.3050 support. There was a break below the 23.6% Fib retracement level of the last wave from the $0.2835 low to $0.3088 high.

The price even cleared the $0.3000 support level and tested the main $0.2950 support level. Besides, the 50% Fib retracement level of the last wave from the $0.2835 low to $0.3088 high prevented losses. The price is currently moving higher and trading well above $0.2950. There is also a key bullish trend line in place with support near $0.2965 on the hourly chart of the XRP/USD pair. The pair seems to be well supported near $0.2960 and $0.2950. Besides, the 100 hourly SMA is also positioned near the $0.2950 support area.

On the upside, an initial resistance is near the $0.3000 level, above which the price may test $0.3020. However, a successful close above $0.3050 will most likely set the pace for more gains above the $0.3100 resistance level. The next key resistances are near $0.3120 and $0.3125.

Ripple Price Analysis XRP Chart

Looking at the chart, ripple price is clearing trading above the key $0.2960 and $0.2950 support levels. If there is a downside break below the $0.2950 support and the 100 hourly SMA, the price could move into a bearish zone. An immediate support is near the $0.2910 level, below which the price may revisit the $0.2850 support level in the near term.

Technical Indicators

Hourly MACD – The MACD for XRP/USD is slowly moving in the bearish zone.
Hourly RSI (Relative Strength Index) – The RSI for XRP/USD is currently below the 50 level, but it is holding the 40 level.
Major Support Levels – $0.2960, $0.2950 and $0.2910>:(
Major Resistance Levels – $0.3020, $0.3050 and $0.3085. :o
Сrypto trader. Where I trade I will not tell)

Offline RaimondRandom

  • Baby Steps
  • *
  • Activity: 9
  • points:
    72
  • Karma: 0
  • Trade Count: (0)
  • Referrals: 0
  • Last Active: May 06, 2019, 05:50:44 PM
    • View Profile

  • Total Badges: 5
    Badges: (View All)
    First Post Fourth year Anniversary Third year Anniversary
Re: Price Analysis:XRP/USD
« Reply #9 on: May 02, 2019, 03:14:14 PM »
is it so necessary to go down before jump in your analysis?

Offline jonathancool220

  • Legendary
  • *
  • *
  • Activity: 1980
  • points:
    21268
  • Karma: 0
  • Bitcoin Mixer| Since 2019
  • Trade Count: (0)
  • Referrals: 0
  • Last Active: February 20, 2024, 05:36:07 AM
    • View Profile

  • Total Badges: 21
    Badges: (View All)
    Fifth year Anniversary Fourth year Anniversary Search
Re: Price Analysis:XRP/USD
« Reply #10 on: May 04, 2019, 05:13:12 PM »
As for me - dump is more likely
Haha I like that !!!

Why do I like DUmp because without Dump all cryptocurrency can not be taken advantage of.
See how the Ripple is given a graph and you say DUmp will happen, so pray for DUmp. LOL

Offline masudginanjar

  • Legendary
  • *
  • *
  • Activity: 1854
  • points:
    19691
  • Karma: 1
  • Anonymous Bitcoin Mixer
  • Trade Count: (0)
  • Referrals: 0
  • Last Active: February 20, 2024, 06:52:33 AM
    • View Profile

  • Total Badges: 22
    Badges: (View All)
    Fifth year Anniversary Fourth year Anniversary Search
Re: Price Analysis:XRP/USD
« Reply #11 on: May 05, 2019, 06:41:06 AM »
Major Support Levels - $ 0.2960, $ 0.2950 and $ 0.2910. > :(
Major Resistance Levels - $ 0.3020, $ 0.3050 and $ 0.3085. : o


This number is just an ordinary count and it can also be predicted by other people who are not experts.
The number above is just an estimate and I (lack of) believe it.
THORMIXER██████
██
██
██
██
██
██
██
██
██
██
██
██████
████████████████████████████████████████████████████████████
.
  Anonymous Bitcoin Mixer 
.
████████████████████████████████████████████████████████████
██████
██
██
██
██
██
██
██
██
██
██
██
██████
██████
██
██
██
██
██
██
██
██
██
██
██
██████
▄▄███████▄▄
▄██████████▀▀███▄
▄████████████▄▄██▀██▄
▄█████████████▀██▄████▄
▄██████████████▄▀██████▄
██████████████▀█▄████████
█████████████████████████
██████████████▄█▀████████
▀██████████████▀▄██████▀
▀█████████████▄██▀████▀
▀████████████▀▀██▄██▀
▀██████████▄▄███▀
▀▀███████▀▀

.
ONION
██████
██
██
██
██
██
██
██
██
██
██
██
██████
██████
██
██
██
██
██
██
██
██
██
██
██
██
████
█████████████████████████████████████████████████████████████████████████
.
START MIX.
█████████████████████████████████████████████████████████████████████████
██████
██
██
██
██
██
██
██
██
██
██
██

██████

Offline Quiks

  • Baby Steps
  • *
  • Activity: 28
  • points:
    100
  • Karma: -1
  • Bitcoin - will save the world!
  • Trade Count: (0)
  • Referrals: 0
  • Last Active: May 18, 2019, 04:34:10 PM
    • View Profile

  • Total Badges: 10
    Badges: (View All)
    10 Posts First Post Fourth year Anniversary
Re: Price Analysis:XRP/USD
« Reply #12 on: May 06, 2019, 11:48:17 AM »
Ripple (XRP) Price Remains Vulnerable Below $0.3050


Ripple price struggled to gain bullish momentum and declined below $0.3000 against the US dollar.
The price is currently trading below key supports and it could extend losses below $0.2940.
There is a short term bearish trend line forming with resistance near $0.2980 on the hourly chart of the XRP/USD pair (data source from Kraken).
The pair remains at a risk of more losses towards the $0.2900 and $0.2850 support levels.
Ripple price is currently in a declining mode against the US Dollar and bitcoin. XRP failed to hold gains and it could continue to move down towards the $0.2850 level.

Ripple Price Analysis

This past week, there were decent gains in ripple price above the $0.3050 level against the US Dollar. The XRP/USD pair traded above the $0.3100 level, but it failed to gain strength above the $0.3120 resistance. As a result, there was a fresh decline below the $0.3080 and $0.3050 support levels. The price recently broke the $0.3000 support, and the 76.4% Fib retracement level of the last wave from the $0.2949 high to $0.3125 high. It opened the doors for a break below the $0.2950 support level.

The price is currently trading with a bearish angle and below the $0.2960 and $0.2950 supports. If it extends losses, the next stop for the bears could be $0.2907 and $0.2900. The 1.236 Fib extension level of the last wave from the $0.2949 high to $0.3125 high is also near the $0.2907. Below $0.2900, there could be a sharp drop towards the key support near $0.2850. The 1.618 Fib extension level of the last wave from the $0.2949 high to $0.3125 high near $0.2840 may also act as a support.

On the upside, there is a strong resistance forming near $0.3000 and the 100 hourly simple moving average. There is also a short term bearish trend line forming with resistance near $0.2980 on the hourly chart of the XRP/USD pair. The pair needs to clear the trend line, the $0.3000 barrier, and the 100 hourly SMA to start a decent upward move. The next key resistance above the $0.3000 level is near the $0.3050 level.

Ripple Price Analysis XRP Chart

Looking at the chart, ripple price is clearly under pressure below the $0.3000 pivot level. Having said that, the $0.3050 level is also a strong resistance. Therefore, as long as the price is below $0.3000 and $0.3050, there is a risk of more losses in the near term.

Technical Indicators

Hourly MACD – The MACD for XRP/USD is currently placed in the bearish zone.
Hourly RSI (Relative Strength Index) – The RSI for XRP/USD declined below the 40 level, with no major recovery sign.
Major Support Levels – $0.2920, $0.2900 and $0.2850.
Major Resistance Levels – $0.3000, $0.3020 and $0.3040.
Сrypto trader. Where I trade I will not tell)

Offline Sudarmono

  • Plagiarism strike
  • Sr. Member
  • *
  • Activity: 646
  • points:
    1001
  • Karma: -2
  • 🔰 FERRUM NETWORK
  • Trade Count: (0)
  • Referrals: 4
  • Last Active: December 20, 2020, 03:12:44 AM
    • View Profile

  • Total Badges: 16
    Badges: (View All)
    10 Posts First Post Fifth year Anniversary
Re: Price Analysis:XRP/USD
« Reply #13 on: May 11, 2019, 04:38:45 PM »
Currently the XPR trade is down, but I strongly believe that XPR will soon recover at a better price by bringing huge profits to those who survive.
Ferrum Network •   ANN • Bounty • Website • Telegram
The First High-Speed Interoperability Network for Real-World Financial Applications

Offline kent47400

  • Legendary
  • *
  • *
  • *
  • Activity: 1994
  • points:
    22638
  • Karma: -1
  • Anonymous Bitcoin Mixer
  • Trade Count: (0)
  • Referrals: 0
  • Last Active: April 10, 2024, 12:23:21 AM
    • View Profile

  • Total Badges: 22
    Badges: (View All)
    Fifth year Anniversary Fourth year Anniversary Search
Re: Price Analysis:XRP/USD
« Reply #14 on: May 20, 2019, 04:28:59 PM »
-
The price drop from the XRP is only temporary and it feels like 1 hour.
On average I also have such thoughts because of my experience with XRP who trade at Binance.
THORMIXER██████
██
██
██
██
██
██
██
██
██
██
██
██████
████████████████████████████████████████████████████████████
.
  Anonymous Bitcoin Mixer 
.
████████████████████████████████████████████████████████████
██████
██
██
██
██
██
██
██
██
██
██
██
██████
██████
██
██
██
██
██
██
██
██
██
██
██
██████
▄▄███████▄▄
▄██████████▀▀███▄
▄████████████▄▄██▀██▄
▄█████████████▀██▄████▄
▄██████████████▄▀██████▄
██████████████▀█▄████████
█████████████████████████
██████████████▄█▀████████
▀██████████████▀▄██████▀
▀█████████████▄██▀████▀
▀████████████▀▀██▄██▀
▀██████████▄▄███▀
▀▀███████▀▀

.
ONION
██████
██
██
██
██
██
██
██
██
██
██
██
██████
██████
██
██
██
██
██
██
██
██
██
██
██
██
████
█████████████████████████████████████████████████████████████████████████
.
START MIX.
█████████████████████████████████████████████████████████████████████████
██████
██
██
██
██
██
██
██
██
██
██
██

██████


ETH & ERC20 Tokens Donations: 0x2143F7146F0AadC0F9d85ea98F23273Da0e002Ab
BNB & BEP20 Tokens Donations: 0xcbDAB774B5659cB905d4db5487F9e2057b96147F
BTC Donations: bc1qjf99wr3dz9jn9fr43q28x0r50zeyxewcq8swng
BTC Tips for Moderators: 1Pz1S3d4Aiq7QE4m3MmuoUPEvKaAYbZRoG
Powered by SMFPacks Social Login Mod