
Litecoin price failed to gain strength above the $80.00 resistance against the US Dollar. LTC started a fresh decline and it could even break the $70.00 support in the near term
- Litecoin price failed to break the $80.00 barrier and declined recently (Data feed of Kraken) against the US Dollar.
- There is a major bearish trend line formed with resistance near the $77.60 level on the 4-hour chart.
- LTC price recently declined below the $74.80 support and a connecting bullish trend line.
Litecoin Price Analysis (LTC)This past week, there were strong gains in bitcoin, but most altcoins such as Ethereum, EOS, ripple, litecoin and others struggled against the US dollar. The LTC/USD pair faced a strong selling interest near the $80.00 resistance and recently started a downward move.
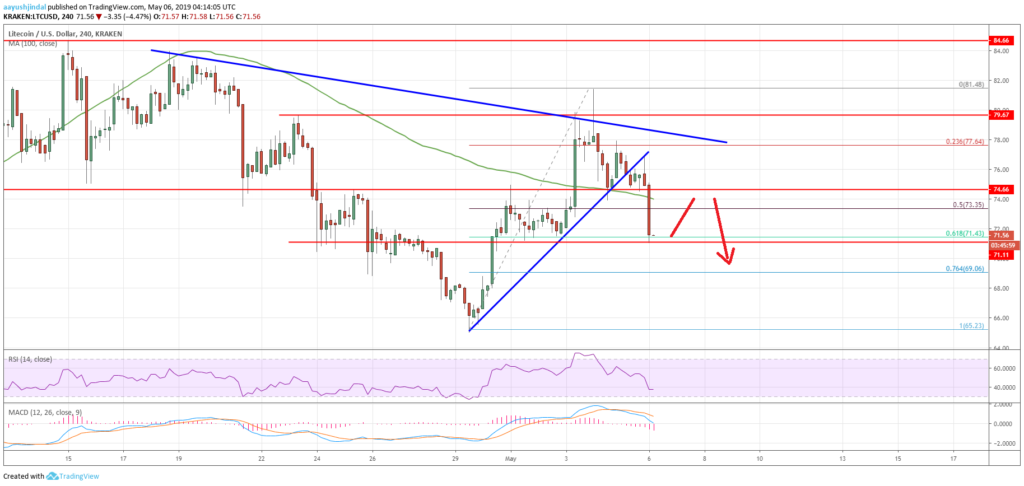
Looking at the 4-hour chart, LTC price topped near the $81.50 level and later declined sharply. There was a break below the $78.00 and $76.00 support levels to push the price back in a bearish zone.
During the decline, the price traded below the $74.80 support and a connecting bullish trend line. Moreover, there was a close below the $75.40 support and the 100 simple moving average (4-hour).
Besides, there was a clear break below the 50% Fib retracement level of the last wave from the $65.23 low to $81.48 high. The price declined below $72.50 and recently tested the $71.20 support area.
It seems like the 61.8% Fib retracement level of the last wave from the $65.23 low to $81.48 high is currently acting as a support. If there is a downside break below $71.20, there is a risk of more losses below the $70.00 support level.
The next key support is near the $68.00 level, where the bulls may appear. On the upside, there is a major bearish trend line formed with resistance near the $77.60 level on the same chart. To start a fresh increase litecoin price must break the $74.80 and $77.60 levels. As long as LTC is below $74.80, there is a risk of more losses below $70.00.
source:
https://ethereumworldnews.com/litecoin-ltc-price-analysis-risk-of-downside-extension-below-70/


 Latest news:
  .
.  .
.  .
.  .
.  .
.  .
.  Shop
Shop

 Bidding Open
 Topic: Litecoin (LTC) Price Analysis: Risk of Downside Extension Below $70 (Read 1459 times)