follow us on twitter . like us on facebook . follow us on instagram . subscribe to our youtube channel . announcements on telegram channel . ask urgent question ONLY . Subscribe to our reddit . Altcoins Talks Shop Shop


This is an Ad. Advertised sites are not endorsement by our Forum. They may be unsafe, untrustworthy, or illegal in your jurisdiction. Advertise Here

Author Topic: Price Analysis BTC/USD  (Read 8705 times)

Offline Quiks

  • Baby Steps
  • *
  • Activity: 28
  • points:
    100
  • Karma: -1
  • Bitcoin - will save the world!
  • Trade Count: (0)
  • Referrals: 0
  • Last Active: May 18, 2019, 04:34:10 PM
    • View Profile

  • Total Badges: 10
    Badges: (View All)
    10 Posts First Post Fourth year Anniversary
Re: Price Analysis BTC/USD
« Reply #15 on: May 07, 2019, 09:26:01 AM »


Bitcoin price rallied another 4% and climbed above $5,850 against the US Dollar.
The price is surging higher, but there are many hurdles near $6,000, $6,070 and $6,100.
There was a break above a crucial bearish trend line at $4,730 on the daily chart of the BTC/USD pair (data feed from Kraken).
The pair could spike above $6,000 or even towards $6,800 before correcting lower sharply.
Bitcoin price is surging higher towards $6,000 against the US Dollar. BTC could extend gains, but it is facing two important hurdles near $6,100 and $6,800 on the daily chart.
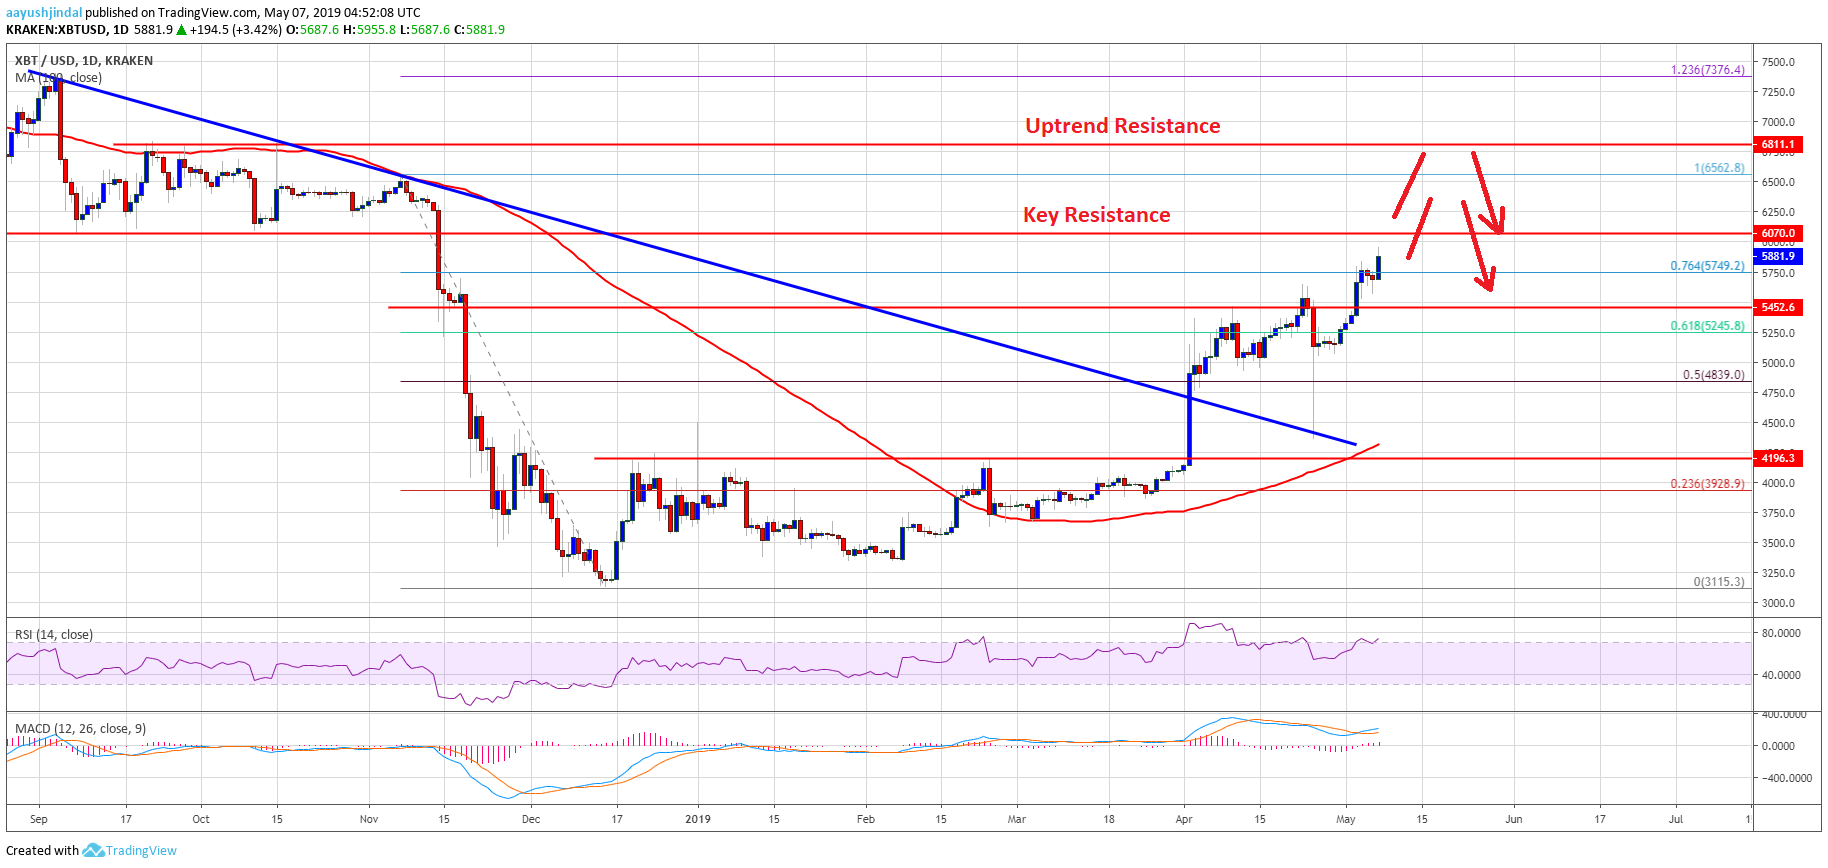
Bitcoin Price Analysis

In the past few days, there was a steady rise in bitcoin price from the $4,000 swing low against the US Dollar. The BTC/USD pair broke the $4,400 and $4,700 resistance levels to start a strong upward move. There was even a close above the $4,200 resistance and the 100-day simple moving average. The bulls pushed the price above the 50% Fib retracement level of the last major decline from the $6,562 high to $3,115 low.

More importantly, there was a break above a crucial bearish trend line at $4,730 on the daily chart of the BTC/USD pair. Recently, the pair broke the $5,250 and $5,500 resistance levels to extend gains. It is now trading well above the 76.4% Fib retracement level of the last major decline from the $6,562 high to $3,115 low. These all are positive signs, suggesting more gains above the $5,900 level. However, there are many hurdles on the upside near the $6,000, $6,070 and $6,100 levels. The $6,070 level was the previous breakdown support and it may now prevent gains.

If there is an upside break above $6,100, there could be an upside extension towards the $6,532 swing high. The main resistance above $6,500 is near the $6,800 level, the main pivot zone of Oct 2018. Therefore, there are chances of a strong bearish reaction from $6,100, $6,500 or $6,800 in the coming days.

Bitcoin Price Analysis BTC Chart

Looking at the chart, bitcoin price seems to be gaining pace above the $5,500 and $5,600 levels. Having said that, the bulls are likely to face a strong offer zone near $6,000, $6,070 and $6,100. If there is a successful close above $6,100, the price may climb higher towards $6,500 or even $6,800 before starting a substantial downside correction. On the downside, there are many supports near $5,540, $5,450 and $5,250. Below these, the price may revisit $5,000.

Technical indicators:

Daily MACD – The MACD is gaining bullish momentum with many positive signs.
Daily RSI (Relative Strength Index) – The RSI for BTC/USD climbed above the 70 level and it seems to be heading towards the 80 level.
Monthly Support Levels – $5,450 followed by $5,250.  ;)
Monthly Resistance Levels – $6,070, $6,500 and $6,800.  ::)
Сrypto trader. Where I trade I will not tell)

Altcoins Talks - Cryptocurrency Forum

Re: Price Analysis BTC/USD
« Reply #15 on: May 07, 2019, 09:26:01 AM »

This is an Ad. Advertised sites are not endorsement by our Forum. They may be unsafe, untrustworthy, or illegal in your jurisdiction. Advertise Here


Offline Quiks

  • Baby Steps
  • *
  • Activity: 28
  • points:
    100
  • Karma: -1
  • Bitcoin - will save the world!
  • Trade Count: (0)
  • Referrals: 0
  • Last Active: May 18, 2019, 04:34:10 PM
    • View Profile

  • Total Badges: 10
    Badges: (View All)
    10 Posts First Post Fourth year Anniversary
Re: Price Analysis BTC/USD
« Reply #16 on: May 10, 2019, 09:34:53 AM »
Bitcoin (BTC) Price Defies Gravity With Upsurge, Bulls Aiming $6.5K


Bitcoin price was unfazed and it recently broke the $6,200 resistance level against the US Dollar.
The price even broke the $6,300 level and it seems like the bulls are now aiming $6,500.
There is a major bullish trend line forming with support at $6,050 on the hourly chart of the BTC/USD pair (data feed from Kraken).
The pair could find a strong buying interest if it corrects lower towards $6,100 or $6,000.
Bitcoin price rallied more than 4% and cleared $6,300 against the US Dollar. BTC remains in a strong uptrend and it seems like the bulls are now aiming a test of $6,400 or even $6,500.

Bitcoin Price Analysis

This week, bitcoin price overcame all hurdles and rallied above $6,000 and $6,200 against the US Dollar. The BTC/USD pair gained bullish momentum after it settled above $6,100 and the 100 hourly simple moving average. Recently, it broke a bullish flag pattern with resistance near $6,040 on the hourly chart to start a strong upward move. As a result, the bulls pushed the price above the $6,250 and $6,300 resistance levels. A new 2019 high was formed at $6,315 and the price is likely to extend gains.

An initial support is near the $6,230 level, and the 23.6% Fib retracement level of the recent rally from the $5,961 low to $6,315 high. If there is a downside extension, the next key support could be $6,140. It represents the 50% Fib retracement level of the recent rally from the $5,961 low to $6,315 high. More importantly, there is a major bullish trend line forming with support at $6,050 on the hourly chart of the BTC/USD pair. Moreover, the previous resistance area near $6,050 is likely to act as a strong buy zone if the price corrects lower.

Besides, the price is now well above the $6,000 pivot level and the bullish 100 hourly SMA. Therefore, there are chances of more upsides above the $6,300 and $6,350 levels. The next main hurdle is near the $6,400 level, above which the price could rally towards the $6,500 level.

Bitcoin Price Analysis BTC Chart

Looking at the chart, bitcoin price is gaining bullish momentum above $6,200 and $6,300, with no major bearish sign. In the short term, there could be a few bearish moves, but dips remain supported near the $6,200 and $6,100 levels. Only a daily close below $6,000 and the 100 hourly SMA could start a substantial downside correction.

Technical indicators:

Hourly MACD – The MACD is currently placed heavily in the bullish zone, with positive signs.
Hourly RSI (Relative Strength Index) – The RSI for BTC/USD
is currently correcting lower in the overbought zone.
Major Support Levels – $6,200 followed by $6,140  :)
Major Resistance Levels – $6,300, $6,400 and $6,500  :o
Сrypto trader. Where I trade I will not tell)

Offline Quiks

  • Baby Steps
  • *
  • Activity: 28
  • points:
    100
  • Karma: -1
  • Bitcoin - will save the world!
  • Trade Count: (0)
  • Referrals: 0
  • Last Active: May 18, 2019, 04:34:10 PM
    • View Profile

  • Total Badges: 10
    Badges: (View All)
    10 Posts First Post Fourth year Anniversary
Re: Price Analysis BTC/USD
« Reply #17 on: May 14, 2019, 11:06:47 AM »
Bitcoin (BTC) Price Forecast Remains Bullish: Bulls Target $8.5K and $9K


Bitcoin price surged more than 10% and broke the key $8,000 barrier against the US Dollar.
The price traded to a new 2019 high close to $8,180 and remains in a strong uptrend.
There is a short term bullish pattern forming with resistance near $8,050 on the hourly chart of the BTC/USD pair (data feed from Kraken).
The pair could rally further towards $8,500 once it breaks $8,050 and $8,100.
Bitcoin price rallied significantly and broke $8,000 against the US Dollar. BTC bulls remain in full control and they are likely to target the $8,500 level in the coming sessions.

Bitcoin Price Analysis

There was no stopping bitcoin after it broke the $7,500 resistance level against the US Dollar. The BTC/USD pair started a fresh rally after forming a swing low at $6,995. It broke the $7,200 and $7,500 resistance levels, plus remained well above the 100 hourly simple moving average. Finally, the bulls were able to clear the last swing high near $7,580 and pushed the price towards the $8,000 barrier. There was a clear break above the $8,000 barrier and the price posted a new 2019 high close to $8,180.

Recently, there was a sharp downside correction below $7,850 and the 23.6% Fib retracement level of the upward move from $6,995 low to $8,172 high. The price even dipped below the $7,800 level. However, the $7,600 level acted as a strong support. Besides, the 50% Fib retracement level of the upward move from $6,995 low to $8,172 high acted as a support. The price is now back above $7,800 and $7,950. Moreover, there is a short term bullish pattern forming with resistance near $8,050 on the hourly chart of the BTC/USD pair.

The pair seems to be ready to clear the triangle resistance at $8,050 and trade towards the $8,172 swing high. Additionally, there are high chances of a break above the $8,200 and $8,320 resistance levels. The next stop for the bulls could be $8,500.

Bitcoin Price Analysis BTC Chart

Looking at the chart, bitcoin price is likely setting up for more gains above the $8,050 and $8,150 levels. Conversely, if there is a downside correction, the price may find buyers near the $7,950 and $7,840 levels. The main support for the current wave is near $7,580 (the recent breakout level). The overall price action is super bullish, with technical indicators pointing a run towards $8,500 or even $9,000.

Technical indicators:

Hourly MACD – The MACD is sighting a fresh increase in the bullish zone.
Hourly RSI (Relative Strength Index) – The RSI for BTC/USD is currently well above the 55 and 60 levels.
Major Support Levels – $7,950 followed by $7,840  :)
Major Resistance Levels – $8,050, $8,170 and $8,320  :o
Сrypto trader. Where I trade I will not tell)

Offline Quiks

  • Baby Steps
  • *
  • Activity: 28
  • points:
    100
  • Karma: -1
  • Bitcoin - will save the world!
  • Trade Count: (0)
  • Referrals: 0
  • Last Active: May 18, 2019, 04:34:10 PM
    • View Profile

  • Total Badges: 10
    Badges: (View All)
    10 Posts First Post Fourth year Anniversary
Re: Price Analysis BTC/USD
« Reply #18 on: May 15, 2019, 10:20:35 AM »
Bitcoin (BTC) Price Primed To Break $8.5K, Dips Remain Supported


Bitcoin price started a downside correction after trading close to $8,350 against the US Dollar.
The price declined below the $8,000 support and tested the $7,600-7,630 support area.
There is a short term bearish trend line forming with resistance near $8,100 on the hourly chart of the BTC/USD pair (data feed from Kraken).
The pair could retest the $7,600 support area before it could start a fresh increase above $8,200.
Bitcoin price corrected lower recently below $8,000 against the US Dollar. However, BTC remains well bid above $7,600 and it is likely to climb back above $8,200 and $8,300.

Bitcoin Price Analysis

Yesterday, we saw an extended rally in bitcoin price above the $8,000 barrier against the US Dollar. The BTC/USD pair broke the $8,200 and $8,300 resistance levels. It traded close to the $8,340 level and a new 2019 high was formed at $8,338. Later, the price started a downside correction below the $8,200 support, but remained well above the 100 hourly simple moving average. The price declined below the $8,000 support level and traded close to the key $7,600 support area. A swing low was formed at $7,631 and the price recovered recently above $8,000.

There was a break above the 50% Fib retracement level of the recent decline from the $8,338 high to $7,631 low. However, the price seems to be facing a strong resistance near $8,150. The 61.8% Fib retracement level of the recent decline from the $8,338 high to $7,631 low is also preventing an upside break. Moreover, there is a short term bearish trend line forming with resistance near $8,100 on the hourly chart of the BTC/USD pair. Therefore, the pair needs to clear the trend line and $8,150 to start a fresh increase.

On the upside, an immediate resistance above $8,150 is at $8,220. The next key resistance is near the $8,340 level, above which the price could test the $8,500 level. The 1.236 Fib extension level of the recent decline from the $8,338 high to $7,631 low is also near the $8,505 level.

Bitcoin Price Analysis BTC Chart

Looking at the chart, bitcoin price is currently consolidating above the $8,000 level. In the short term, there could be another drop towards $7,850 or even $7,630. However, there are many support on the downside near the $7,580 and $7,600 levels. Besides, this week’s followed important bullish trend line is intact with support at $7,580. As long as the price is above the trend line support, it is likely to break $8,150 and $8,340.

Technical indicators:

Hourly MACD – The MACD is likely to move back in the bullish zone
Hourly RSI (Relative Strength Index) – The RSI for BTC/USD is currently flat above the 50 level
Major Support Levels – $7,850 followed by $7,630  :)
Major Resistance Levels – $8,100, $8,150 and $8,340  ;)
Сrypto trader. Where I trade I will not tell)


ETH & ERC20 Tokens Donations: 0x2143F7146F0AadC0F9d85ea98F23273Da0e002Ab
BNB & BEP20 Tokens Donations: 0xcbDAB774B5659cB905d4db5487F9e2057b96147F
BTC Donations: bc1qjf99wr3dz9jn9fr43q28x0r50zeyxewcq8swng
BTC Tips for Moderators: 1Pz1S3d4Aiq7QE4m3MmuoUPEvKaAYbZRoG
Powered by SMFPacks Social Login Mod