- ETH price broke a few important resistance levels near the $134 level against the US Dollar.
- The price gained traction and settled above the $134 and $136 resistance levels.
- This was a break above a few continuation patterns near $133 and $136 on the hourly chart of ETH/USD (data feed via Kraken).
- The pair is currently trading near the $139 resistance and it could continue to trade higher in the near term.
- Ethereum price is gaining bullish momentum against the US Dollar and bitcoin. ETH is likely to break the $139, $144 and $146 resistance levels to move into a positive zone.
Ethereum Price AnalysisYesterday, we discussed that ETH price remains supported for more upsides towards the $135, $137 and $140 levels against the US Dollar. The ETH/USD pair formed a solid support near the $133 level and later started an upside move. It broke the $134 resistance and settled above the 100 hourly simple moving average. It opened the doors for more gains and the price traded above the $135 and $137 resistance levels.
During the rise, there was a break above a few continuation patterns near $133 and $136 on the hourly chart of ETH/USD. The pair even broke the $138 resistance and tested the $139 hurdle. Recently, there was minor dip after the price tested the $139 resistance. It tested the 23.6% Fib retracement level of the recent leg from the $135 swing low to $139 high. However, the price remains well supported and downsides are likely to be contained by the $138 support.
If there are more losses, the next key support could be $137. It coincides with the 50% Fib retracement level of the recent leg from the $135 swing low to $139 high. Any further losses may push the price back towards the main support at $134. On the upside, a break above the $139 resistance may push the price towards the $141 resistance levels. The current price action is very bullish and suggests that there are high chances of more gains above the $142 and $144 resistance levels.
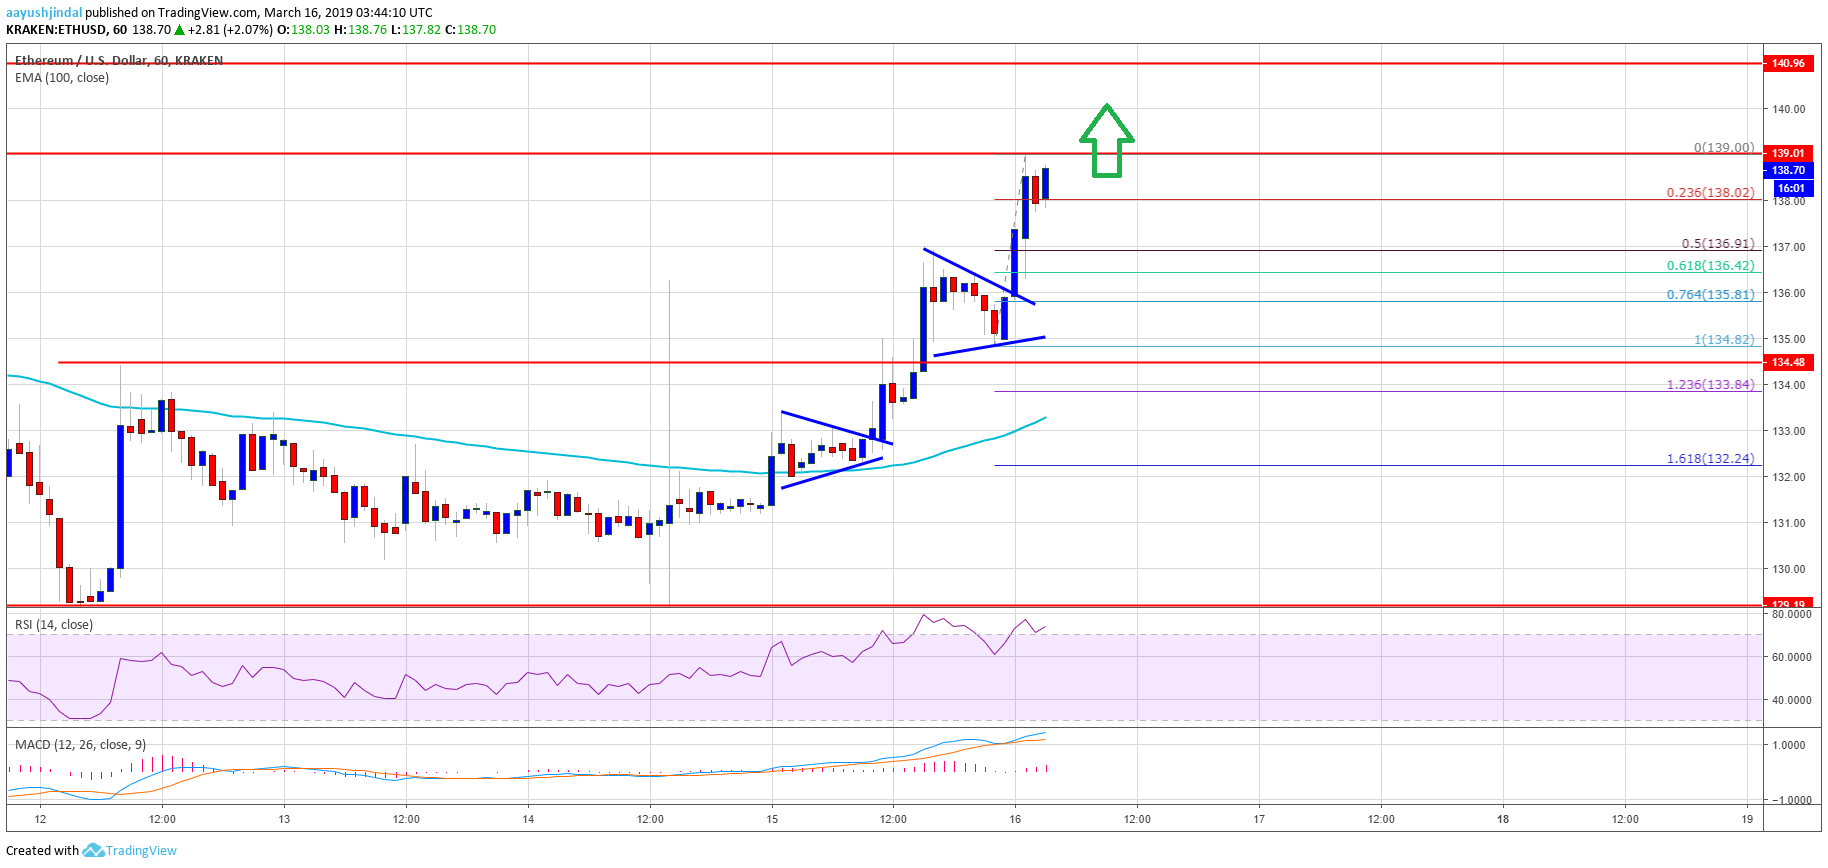
Looking at the chart, ETH price is trading with a positive bias above the $137 and $134 supports. In the short term, there could be a few range moves or dips towards $135. However, the overall structure is positive, calling for more gains above the $140 and $142 levels in the coming sessions.
ETH Technical IndicatorsHourly MACD – The MACD for ETH/USD is showing positive signs in the bullish zone.
Hourly RSI – The RSI for ETH/USD is now placed well above the 60 level, with a strong bullish angle.
Major Support Level – $137
Major Resistance Level – $141
source:
https://www.newsbtc.com/2019/03/16/ethereum-price-analysis-eth-bulls-are-back-150-could-be-next/


 Latest news:
  .
.  .
.  .
.  .
.  .
.  .
.  Shop
Shop

 Topic: Ethereum Price Analysis: ETH Bulls Are Back, $150 Could Be Next (Read 1432 times)