In 2008, Satoshi Nakamoto created Bitcoin to make it serve as an uncorrelated asset. However, this remarkable currency shows a correlation with some real world assets such as stocks, index or commodity. This paper will analysis the relationship between bitcoin and S&P 500 in different points of view.
Bitcoin is the largest blockchain-based digital asset, with a market capitalization of $896.7 billion as of December 2021. It is wildly popular among cryptocurrency enthusiasts and speculative investors. If you have been following the cryptocurrency market, you might notice a phenomenon: if Bitcoin price declines, altcoins will follow, and the opposite is equally true. There are many reasons that Bitcoin will lead the market and it will not be discussed in this paper. So Bitcoin is chosen to represent the performance of crypto world.
The S&P 500, which is short for Standard & Poor’s 500, was introduced in 1957 as a stock market index to track the value of 500 corporations that have their stocks listed on the New York Stock Exchange (NYSE) and the NASDAQ Composite. The collection of stocks that make up the S&P 500 is designed to represent the overall composition of the U.S. economy. Daily closed price in historical data from 2015–11–15 to 2021–12–15 will be used to figure out the correlation. Those sample prices will exclude holiday data to be smooth.
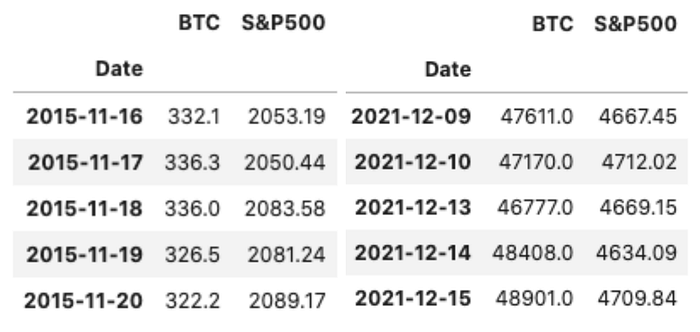
1533 sets of data are collected, the head and tail as shown below:
Firstly, just simply check the Pearson r between them, and the result is 0.899855, highly close to 1, which means BTC and S&P500 are highly positively correlated in the range of sample data. When S&P rises, BTC’s price will possibly go up. The graph also suggests a relationship with 45 degree up right line.
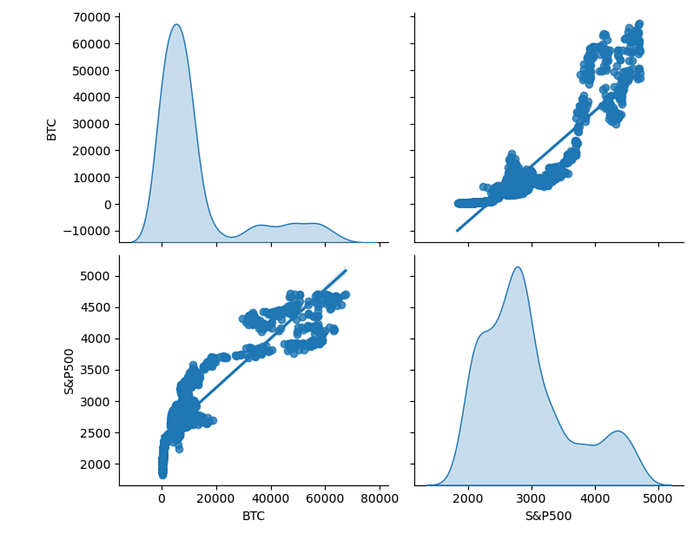
Scipy computed Pearson r: 0.8998546848871993 and p-value: 0.0

After the overall Pearson r is found, a roll-over relationship is also very interesting. Then we will try to find exact time change in the correlation between them. In the methodology applied in this paper, a window includes 30 days’ data will be set and moving rollover to iteratively calculate the results until all the data had been included. The following graph will show the result:
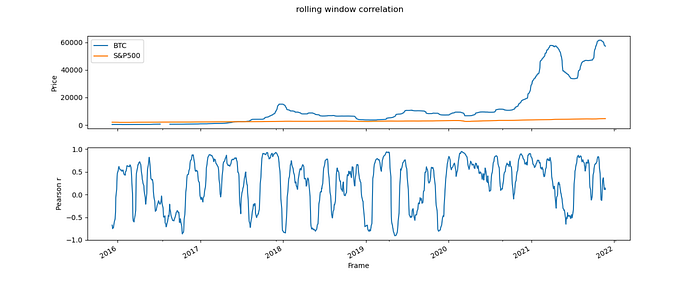
Different from the overall data, it tells an interesting story. Pearson r has high volatility over time, upper to 1 and lower to -1. In a specific time range, it is very hard to tell the relationship. For most of the time, the two have positive relationship with a positive r, but sometimes, they may have negative correlation. There are some economics reasons behind: BTC is much more volatile than S&P500, because S&P is easy to be influenced by the monetary and fiscal policy, and the government will roll out some policies such as Circuit breaker to support the index. Too big to be fail, with a strong backer, S&P will decease less than BTC once the economic skies look troubled and turbulent. But BTC will recover better and faster during the global market recovery. Due to the decentralization and less capitalization, BTC is much easier be affected by the market.
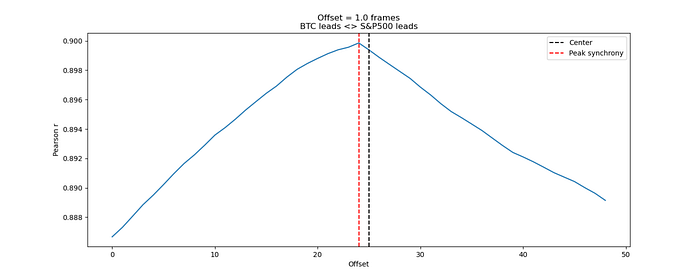
We can conclude that those two assets are correlated to each other with some cautious assumptions. The correlations between the two assets are significantly different by which slice of time window that we are looking at. In order to find out the correlation between two vectors of time series, in this paper, Dynamic Time Lagged Cross Correlation (TLCC) which essentially associates data of two time series with each other, including the stationary time interval between them. If offset=0, it means they have a directly positive relationship; if not, a variable may lead another. In our case, offset=1, and peaked in intraday trading the previous day. In this sample, S&P500 will lead the performance of BTC 1day before.
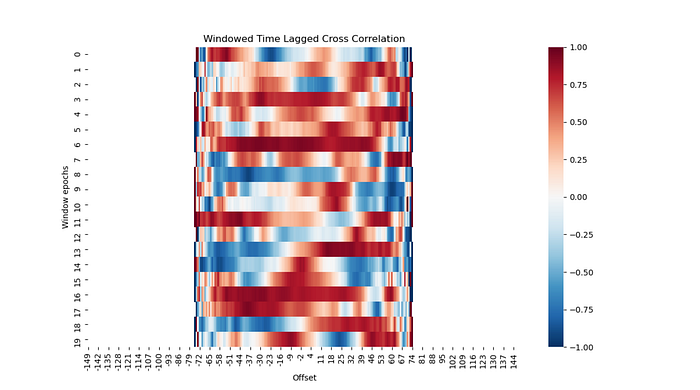
However, the signal is dynamic. In order to find more details in the change, a window can be added to roll-over the calculation. Then we can collect the data from all the windows to compare the relationship to find out which one leads the change. We equally separate the data into 20 windows. The red color means the variable that may lead the change. For example, in the first row, most of the red is on the left, so BTC will lead.In the second row, most of the red is on the right, so S&P will lead.
Generally, most red blocks are on the right, so we can conclude that for most of the time in those samples, S&P will lead the change. However, there is some time when BTC leads. But the offset is changing over time, so we cannot find out exactly for how much time one asset will lead another.


 Latest news:
  .
.  .
.  .
.  .
.  .
.  .
.  Shop
Shop

 Bidding Open
 Topic: S&P 500 and BTC, Friend or Foe? (Read 628 times)