follow us on twitter . like us on facebook . follow us on instagram . subscribe to our youtube channel . announcements on telegram channel . ask urgent question ONLY . Subscribe to our reddit . Altcoins Talks Shop Shop


This is an Ad. Advertised sites are not endorsement by our Forum. They may be unsafe, untrustworthy, or illegal in your jurisdiction. Advertise Here Ads bidding Bidding Open

Show Posts

This section allows you to view all posts made by this member. Note that you can only see posts made in areas you currently have access to.


Topics - AMANPURI OFFICIAL INDONESIA

Pages: [1] 2 3 ... 6
1
High Leverage Asset Protection


Bergabunglah dengan Amanpuri Indonesia


2
XRP and Stellar lumens have been trading inside distinct trading patterns over the last few days and months. In addition, they are both preparing to move in different directions.

While both are trading near their respective support lines, the technical indicators reveal important differences. Bearish divergence in the RSI suggests that XLM may breakdown from its short-term trading pattern. However, XRP may have recently begun a new uptrend.

Stellar Lumens in a Symmetrical Triangle
The price of XLM reached a low of $0.115 on May 15. A rapid increase ensued and the price reached a high of $0.162 on May 16. The price has been decreasing since.

XLM/USD has since been trading inside the symmetrical triangle outlined below:


XRP Inside a Broadening Wedge
Unlike XLM, XRP/USD has been trading inside a short-term ascending broadening wedge since May 17. On that day, a low of $0.356 was reached—generating the support line. Similarly, the resistance line was formed on the same day when a high of $0.382 was reached.


The resistance and support lines have been touched four and five times respectively. At the time for writing, the price is trading very close to the support line of the wedge.

Upward movement toward the resistance line may be expected. At the same time, the price might fall—causing a breakdown.

Assessing Moving Averages
To better determine future price fluctuations for XRP, we analyze the cryptocurrency at one-hour intervals alongside the 100- and 200-period moving averages below:


source: https://beincrypto.com/xrp-uptrend-bearish-divergence-stellar-lumens-may-21-price-analysis-xrp-xlm/

3
On May 20, 2019, we analyzed Ethereum (ETH and Ethereum Classic (ETC) to predict future price fluctuations. In this analysis, we assess the validity of our predictions.

We begin by examining the trading patterns of each of the coins and then assess their technical indicators. By comparing them to those observed yesterday, we are able to make a more thorough assessment of the cryptocurrencies.

Ethereum In a Broadening Wedge
Since May 17, ETH/USD has been trading within a short-term ascending broadening wedge. During this period, gradual increases have been observed:


ETH dropped from the resistance line on May 20 to validate the support line. A slight reversal brought the price back into the middle of the wedge where it is still trading at the time of writing.

Short-Term Increase?
To better predict The price of Ethereum is analyzed alongside the 100- and 200-period moving averages below:


On May 20, the 100-period MA crossed above the 200-period one. This is known as a bullish cross and often indicates that an uptrend has begun. Furthermore, this was succeeded by a price increase above both moving averages.

In yesterday’s analysis, we noted that bearish divergence had recently been generated within the RSI and MACD. Because this was occurring within a bearish pattern, we predicted: “the price of ETH will decrease towards the support line of the wedge.”

The support line was reached after our analysis was published. Then the price rebounded to its current position.

Given May 20’s bullish cross, ETH may experience slight increases inside the confines of the wedge. However, there remains bearish divergence in a bearish pattern suggests that a breakout is unlikely.

The price may still reach the support line after any future hourly gains.

Ethereum Classic Inside a Symmetrical Triangle
ETC/USD reached an hourly low of $6.66 on May 15 and generated an ascending support line. After reaching a high of $8.48 the next day, a resistance line emerged.

Since that time, ETC has been decreasing inside the symmetrical triangle outlined below:


At the time of writing, the price is trading slightly above the support line of the triangle.

Possible Top
The price of ETC is analyzed at 12-hour intervals alongside the RSI to assess possible future price fluctuations. During this period, ETC has been following an ascending support line since February. No resistance line is yet apparent for this period.

The triangle traced in the previous section is well above the long-term support line:


Bearish divergence is observed within the RSI for the period May 15 to 19. In addition, bearish divergence was observed in both the RSI and MACD between Apr 7 to May 16 in yesterday’s analysis.

This suggests ETC is likely to breakdown from the triangle and reach the long-term support line traced above. Prices may reach $6.

Conclusion
In the short term, ETH is trading inside a broadening wedge while ETC’s price is trading inside a symmetrical triangle. Additionally, ETH has generated a short-term bullish cross while ETC has generated significant long-term bearish divergence in the RSI.

Therefore, we believe that ETC will soon break down from its short-term trading pattern and drop towards the long-term support line. ETH, on the other hand, may experience slight gains before dropping. A breakdown does not currently appear likely for ETH.

source: https://beincrypto.com/bullish-cross-ethereum-breakdown-ethereum-classic-eth-etc-price-analysis-may-21/

4
IOTA (MIOTA) and DASH (DASH) have both recently initiated upward moves and validated their respective resistance lines.

Furthermore, MIOTA has been trading near its resistance for several days. DASH, on the other hand, reached the resistance line earlier this week before experiencing slight price losses.


A breakout appears possible for both, but we must analyze the cryptocurrencies in more depth before we can draw any conclusion. We begin our analysis by looking at IOTA:

IOTA Reaches Resistance
MIOTA/USD reached a low of 4400 satoshis on Apr 26. A rapid upward move followed, and the price reached a high of 6244 satoshis on Apr 29.

Subsequently, the price began falling. It validated the support line on May 13 before pushing upward to the resistance line.  The price has been decreasing since, trading inside the descending channel outlined below:


After reaching the resistance on May 15, it began trading sideways. Since that time, it has continued trading slightly below the resistance line. During this period, the line has been validated several times.

Possible Reversal
At the current time, MIOTA could drop toward the support line and possibly validate it. However, it could also begin increasing again and breakout from its current trading pattern. To determine which is more likely, the price of MIOTA is analyzed alongside the RSI and the MACD below:


Between May 16 and 19, bearish divergence can be observed within the RSI and MACD. This suggests that price should likely decrease soon. A breakout does not appear likely.

DASH Inside An Ascending Channel
On May 4, the price of DASH reached a high of $130.36. A gradual decrease followed. the price reached a low of $111.11 on May 10.

Since then, the price has been increasing, trading inside the ascending channel outlined below

[img]https://3xz7gj47vd1t2zgr1q19hmwl-wpengine.netdna-ssl.com/wp-content/uploads/2019/05/DASH-Outlook.png[/img

more complete: https://beincrypto.com/trade-war-conclusion-market-rallies/

5
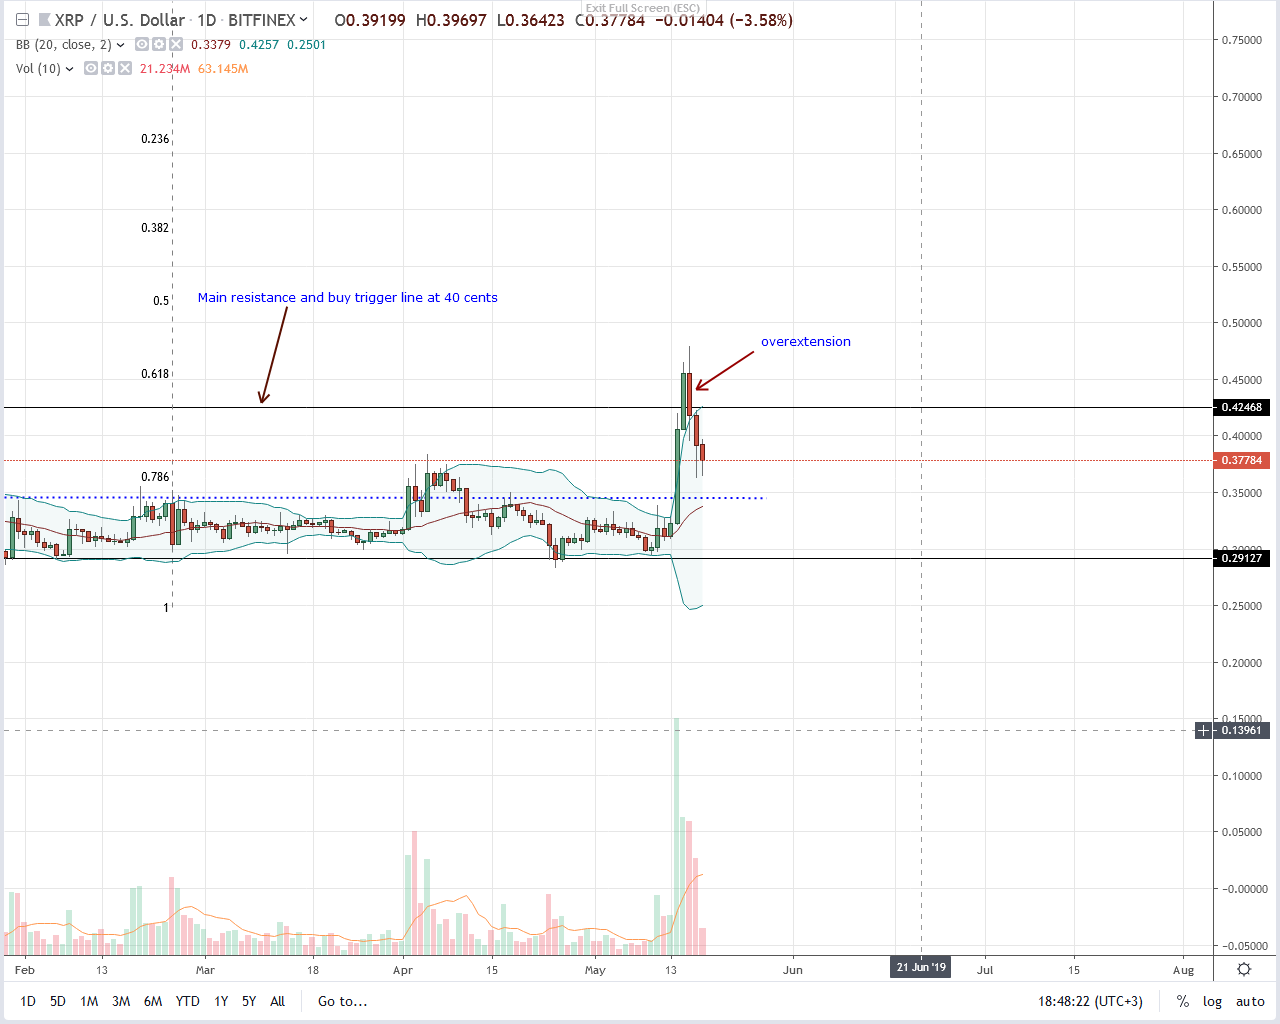
Coin Metrics now reports that Ripple Labs did under-reported the number of XRP released from escrow by a total of 200 million XRP while implementing the “escrow queue” differently than announced. The reaction could be heaping pressure on XRP which is fast dropping, clawing back this week’s gains.

Ripple Price Analysis
Fundamentals
According to a Coin Metrics report, Ripple Labs is allegedly misrepresenting the actual amount of XRP in their escrow accounts.

In two different occasions, the blockchain analytics firm said the XRP issuer “under-reported the number of XRP released from escrow by a total of 200 million XRP ($84 million at current prices)” further adding “other party/parties, potentially associated with Ripple, have released 55 million XRP from an unknown escrow address not connected to the main Ripple escrow account.”

However, it was the revelation that “the “escrow queue” is implemented differently than announced, leading to a faster future release of escrowed funds compared to the announced schedule,” that is drawing criticism to Ripple Labs and Ripple Inc, the majority holders of XRP.

“A scam is a scam. Tokens made out of thin air are not true crypto in any shape or form. Just a nice way to print free money got to give it to ripple though. They have created a new central bank by selling their shitcoins to fools who keep buying it up thinking they gonna rich.”

In an attempt to pour cold water on the finding, David Schwartz, the CTO of Ripple Inc, took to Twitter saying “regarding the chatter about reporting methodology around XRP escrow in Ripple’s quarterly XRP Markets Reports: this is simply a timeline issue.”

Candlestick Arrangement


Like other crypto assets, Ripple (XRP) is under pressure. Even so, thanks to sharp upswings mid this week, the asset is up 25.6 percent in the last week. All the same, candlestick arrangement point to bulls but bears are temporarily in charge.

Note that although sellers are pressing lower, they are yet to reverse gains of May 14th, the breakout bar and the trigger of the first wave of higher highs targeting Q1 2019 highs. Therefore, it is imperative that buyers build enough momentum to drive prices above May 15th highs since bulls are in control from an effort versus result point of view—prices are oscillating within May 14th high low.

Once that prints out, then we shall trade in line with our previous XRP/USD trade plan with targets at 60 cents.

Technical Indicators
As aforementioned, May 14th bar is our anchor bar. Holding price action of the last two days, buyers are therefore in charge. However, it is after prices close above 40 cents complete with high transaction volumes, preferably above 108 million that risk-averse traders can buy on dips with targets at 60 cents.

source: https://www.newsbtc.com/2019/05/18/ripple-xrp-bulls-firm-despite-coin-metric-report/

6
As Bitcoin breaks significant resistance at $6,000 and $8,000, all within the space of a week, interest is reaching fever point. But despite the strong performance, which some say is buoyed by economic uncertainty over the US-China trade war, there are those among us who remain skeptical.

Bitcoin FOMO
An impressive week for cryptocurrencies saw Bitcoin break the $8,000 mark on Tuesday. Up 120% since the start of the year, this momentum is continuing to lead the rest of the market into a bull run. Unsurprisingly, mainstream news outlets and everyday people are once again talking about Bitcoin.

In view of this, Bitcoin advocate, Thomas Lee of Fundstrat Global Advisors, believes no-coiners will FOMO into cryptocurrencies. Speaking to CNBC, he said:

“There have been positive developments, including some of the announcements coming out of Consensus, like the BAKKT launch and merchants starting to accept Bitcoin. But, what’s getting investors quite optimistic is that, now Bitcoin is approaching that $10,000 level, I think there’s an increasing chance that traditional non-crypto investors are going to start looking at crypto again.”

Lee went on to talk about the importance of getting new investment into the space. Which he believes will be the key catalyst for pushing prices back towards all-time-highs.

All-Time-Highs
Thomas Lee has continually pushed bullish sentiment, even during the height of crypto winter, which saw Bitcoin lows of around $3,200. And as each day passes, it looks more and more certain that we have finally left the bear market behind. Part of the reason behind the upswing may relate to economic uncertainty caused by the US-China trade war, which Lee mentioned in the CNBC interview.

Last week, Trump announced a tariff hike on Chinese imports from 10% to 25%. This move was the culmination of months of political wrangling, which only served to strain already tense relations.

more complete: https://www.newsbtc.com/2019/05/17/bitcoin-fomo-is-strong-but-the-bears-will-not-go-quietly/


7


Ripple (XRP) has received attention from two sides. One considers that XRP is headed for adoption by major financial institutions while the other camp sneers at insisting that it cannot be classified as a utility because of the level of centralization as a fund-raising tool, if not an air-drop.

There’s a third angle to see XRP when comparing it with other coins; the kind of publicity it has whether as a platform, an alternative digital asset, or the quality of the team.

As XRP_Anderson tweeted:

“Considering the recent issues having to do with some of the largest cryptos in the market, I would say, I believe XRP is much far ahead of than what we realize. Yes, I said it! Just being honest! How many issues are you seeing XRP having?”

Anderson is right

On a deeper level, XRP_Anderson is right. A look at the top cryptos, including Bitcoin (BTC) and Ethereum (ETH), reveals just how superior Ripple as a network is.

more complete: https://ethereumworldnews.com/why-ripple-xrp-is-far-ahead-of-other-projects-than-we-realize/

8
Binance Reopens Trading, Despite Incomplete Fund Recovery As Hackers Look To Sell Discounted BTC

he cryptocurrency community bonds together in times of trouble, and that has been proven once again with Binance. Though the platform has succumbed to an unfortunate hacking, multiple players of the industry have spoke out about their support and willingness to help. What will Binance do next?


Binance Reopens Trading, Despite Fund Recovery Being Incomplete
-Binance has reopened trading for their platform, following a massive hack almost two weeks ago.
-Reddit user suggests that the BTC is being sold at a 70% discount on another website.

The recent hacking of the Binance platform on May 7th has been highly publicized, as the hackers managed to get away with 7,000 BTC. In total, the theft was worth about $40 million, and CEO Changpeng Zhao was proactive about handling the issues that the platform faced. The company quickly shut down deposits and withdrawals on the exchange while they went through an investigation.

By May 16th, the platform reopened these processes, though the company still has not recovered the funds.

In the meantime, it looks like attacks against Binance has not stopped. A user on Reddit spoke out on the r/Cryptocurrency subreddit, saying that the team that committed the theft was now selling the BTC at a 70% discount.

more complete: https://bitcoinexchangeguide.com/binance-reopens-trading-despite-incomplete-fund-recovery-as-hackers-look-to-sell-discounted-btc/

9
In our latest Cryptocurrency vs. Cannabis price analysis, we noted that Ethereum has spiked by over 40% during the last week.

Ethereum Classic has also seen recent gains but appears to have broken down from a short-term trading pattern recently. Will Ethereum Classic come falling down as Ethereum pushes forward to new heights?

more complete: https://beincrypto.com/binance-coin-tron-reached-peak-after-sruge/

10
https://ethereumworldnews.com/wp-content/uploads/2018/12/Ethereum-Price.jpg

For the third day in a row crypto markets have hit a new 2019 high in terms of market capitalization. This time Ethereum is in the driving seat as it surges 20 percent in a day. Will the other altcoins follow suit when Bitcoin corrects?

BTC Correction Inevitable
Markets always pull back; we have seen it countless times over the past few years. The Bitcoin parabola cannot continue and a correction is inevitable. However, a few hours ago during Asian trading Bitcoin hit another new high for the year at $8,300. This is its highest level for a year aside from a brief spike in July 2018. It has since retraced back to $8,000 where things are holding for the time being.

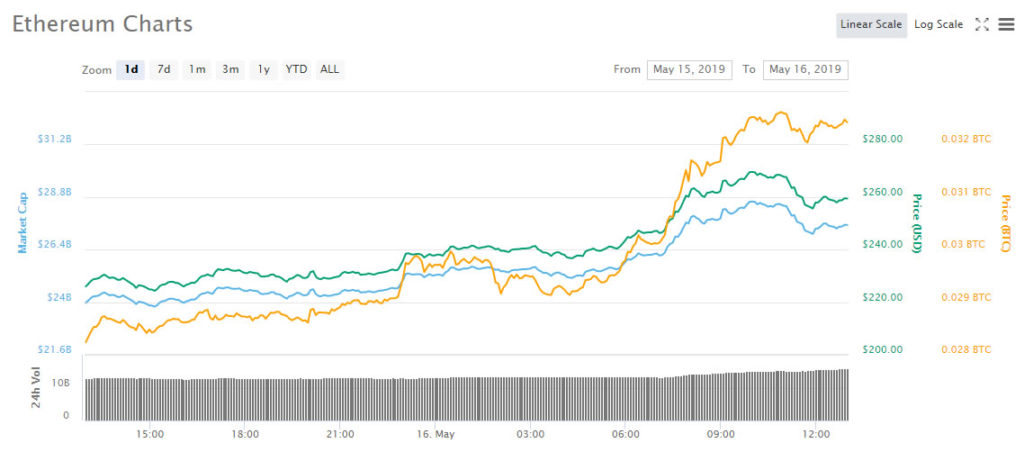
Ethereum is getting the FOMO today as it pumps a whopping 20%. From an intraday low of $225 ETH surged to $270 before pulling back slightly. This is the highest price Ethereum has seen since August 2018. Daily volume is currently at record levels of over $15 billion which is higher than it was during the 2017 bull run.

Comparatively, however, ETH prices are still on the floor and down over 80 percent from its all-time high above $1,400. Bitcoin has now recovered to a 60 percent drop from its peak of $20k in 2017. As traders take profits from Bitcoin’s recent rally they are likely to look towards lower priced altcoins rather than converting back into fiat.


Altcoins To The Moon
This appears to be what is happening at the moment as altcoins start surging, led by Ethereum. Stellar is a train at the moment, surging over 30 percent today to reach an intraday high of $0.157. XLM has not been at these lofty heights since before the big November dump. As a result it is poised to knock Tether off eighth spot in terms of market cap.

Bitcoin Cash, Litecoin, EOS, Binance Coin, Cardano, Tron, Bitcoin SV and IOTA have all pumped a further 7 percent today as altcoins lift off. Ethereum Classic is shadowing its big brother with a 15 percent surge and NEM has gone to the moon adding 35 percent on the day.


source: https://ethereumworldnews.com/ethereum-surges-20-will-altcoins-pump-when-bitcoin-corrects/


11
Ethereum’s Decentralization in Question with 376 Wallets Holding One-Third of All ETH


According to a new research by Chainalysis Inc., there are just 376 wallets holding as much as one-third of all the Ether, the token that runs the Ethereum blockchain. This figure is surprising for a few reasons, namely that it calls into question the level of decentralisation of the coin, as well as what the tokens are being used for.

The cryptocurrency market is still a relatively small one, and in that there has often been cases where big wallets and Whales have had enough capital behind them to move and manipulate the market – especially for Bitcoin where Chainanalysis found that 448 people own 20 percent of all Bitcoin.

However, the fact that Ethereum is also prone to these Whales shows that the second biggest cryptocurrency by market cap and the pioneer of smart contract blockchains also might have a problem with distribution and decentralisation.

Whale Watching

Uncovering these Ethereum Whales is interesting to note as Ether, unlike Bitcoin, has not got the same single function as a store of value and is intended to be used upon the smart contract platform. However, there are clearly still selected individuals who hold large stores of the currency.

This 30 percent of Ether being held by a small number of people detracts from the decentralised aspect of major cryptocurrencies like this, but it also leads to questions of market manipulation should these 376 wallets operate with intention in trading.

That being said, the research has shown that these wallets are mostly holding.

Kim Grauer, a senior economist at the company, said: “The majority of whales aren’t traders. They’re mostly holding.”

However, Chainalysis did look at the effect Ether whales have on its price, and found that when a whale moves Ether from a wallet to an exchange, there is a small but statistically significant effect on market volatility.

Looking for true decentralisation

There have been concerns in the past about Bitcoin and that much of its value belongs to a small fraction of the population that uses the cryptocurrency. There has been instances where Whales, or groups of high-value wallets have banded together to cause movements in the market on purpose. This has raised the eyebrows of the likes of the SEC.

For Ethereum also to be in a situation where its distribution is not as advanced as one would hope, and its decentralisation as a smart contract blockchain also in question, there are questions that need to be raised about effectiveness as a decentralised platform.

source: https://ethereumworldnews.com/ethereums-decentralization-in-question-with-376-wallets-holding-one-third-of-all-eth/

12
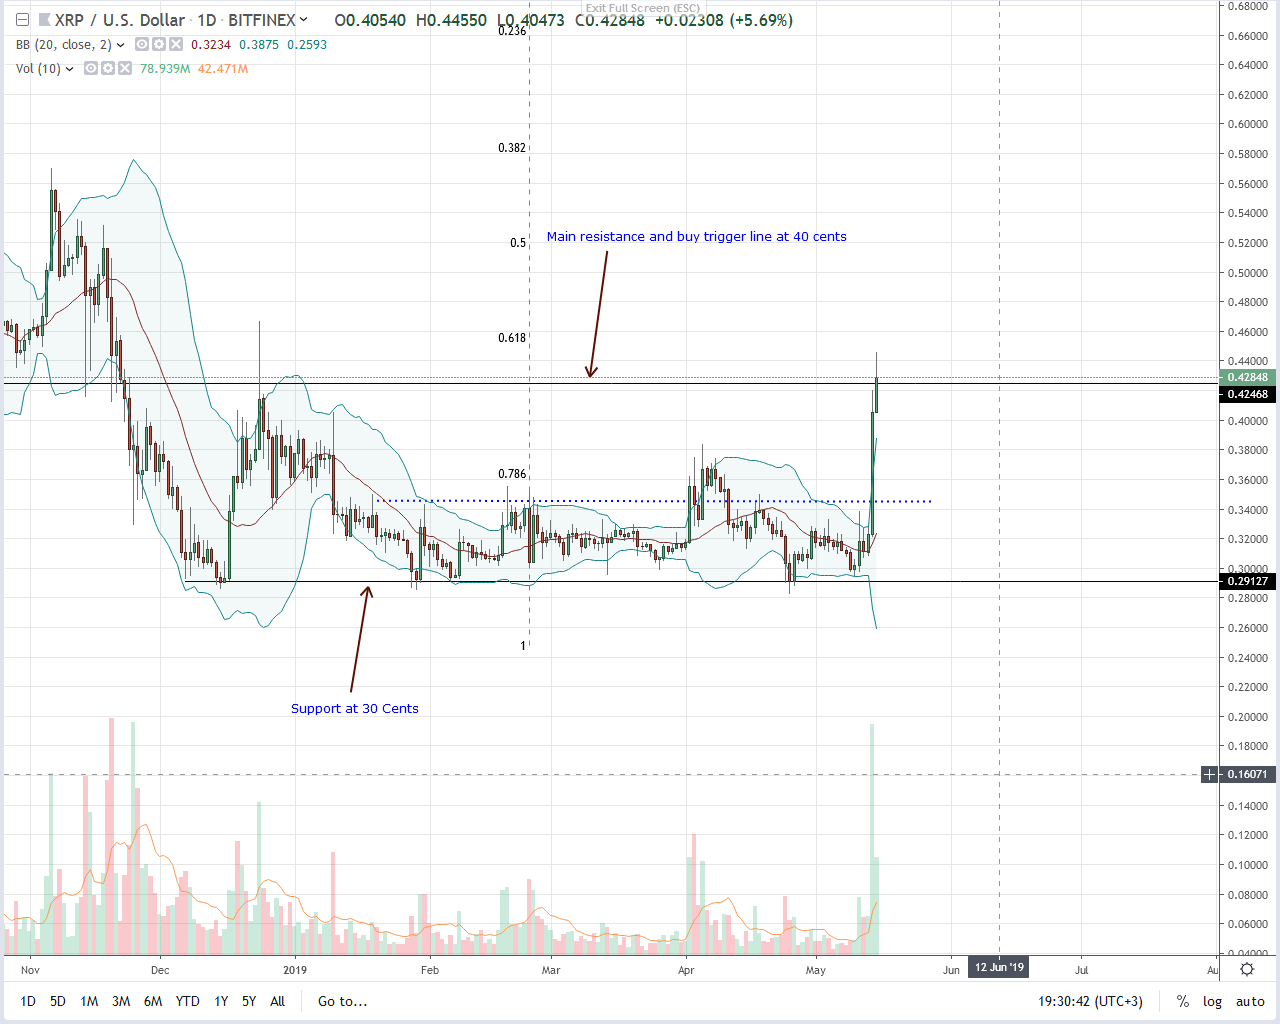
After a six-month consolidation, the stage is ready for Ripple (XRP). Up 44.2 percent at the time of press, XRP is closing in on Ethereum (ETH) and could flip the asset if there is a ballpark 25 percent price increment. At this pace, bulls should set their targets at 80 cents and even $1.40.

Ripple Price Analysis
Fundamentals
Before May-14, Ripple (XRP) performance had been lackluster. Underperforming Bitcoin (BTC) and other top-10 liquid assets, observers said the XRP was decoupling to the delight of Brad Garlinghouse, the CEO of Ripple Inc. In his view, the final decoupling from Bitcoin would be mainly because of the “investor rationale.” That will be when investors would appreciate what each project brings to the table. While talking to CNBC, the crypto leader said:

“There’s a very high correlation between the price of XRP and the price of Bitcoin, but ultimately these are independent open-sourced technologies. It’s early, over time you’ll see a more rational market and behaviors that reflect that.”

He further adds that most crypto assets will “disappear” in a decade because the sphere “is still a nascent industry, the speculation in the market dominates the trading activity. I think it’s a matter of time until people better understand the different use cases.”

However, with CoinBase Pro decision to support XRP trading in the stringent, compliance demanding state of New York is a big boost for the asset. To some extent, it does clear XRP of the “security” tag, allowing for unbridled investment in the world’s third most liquid asset.

Candlestick Arrangement


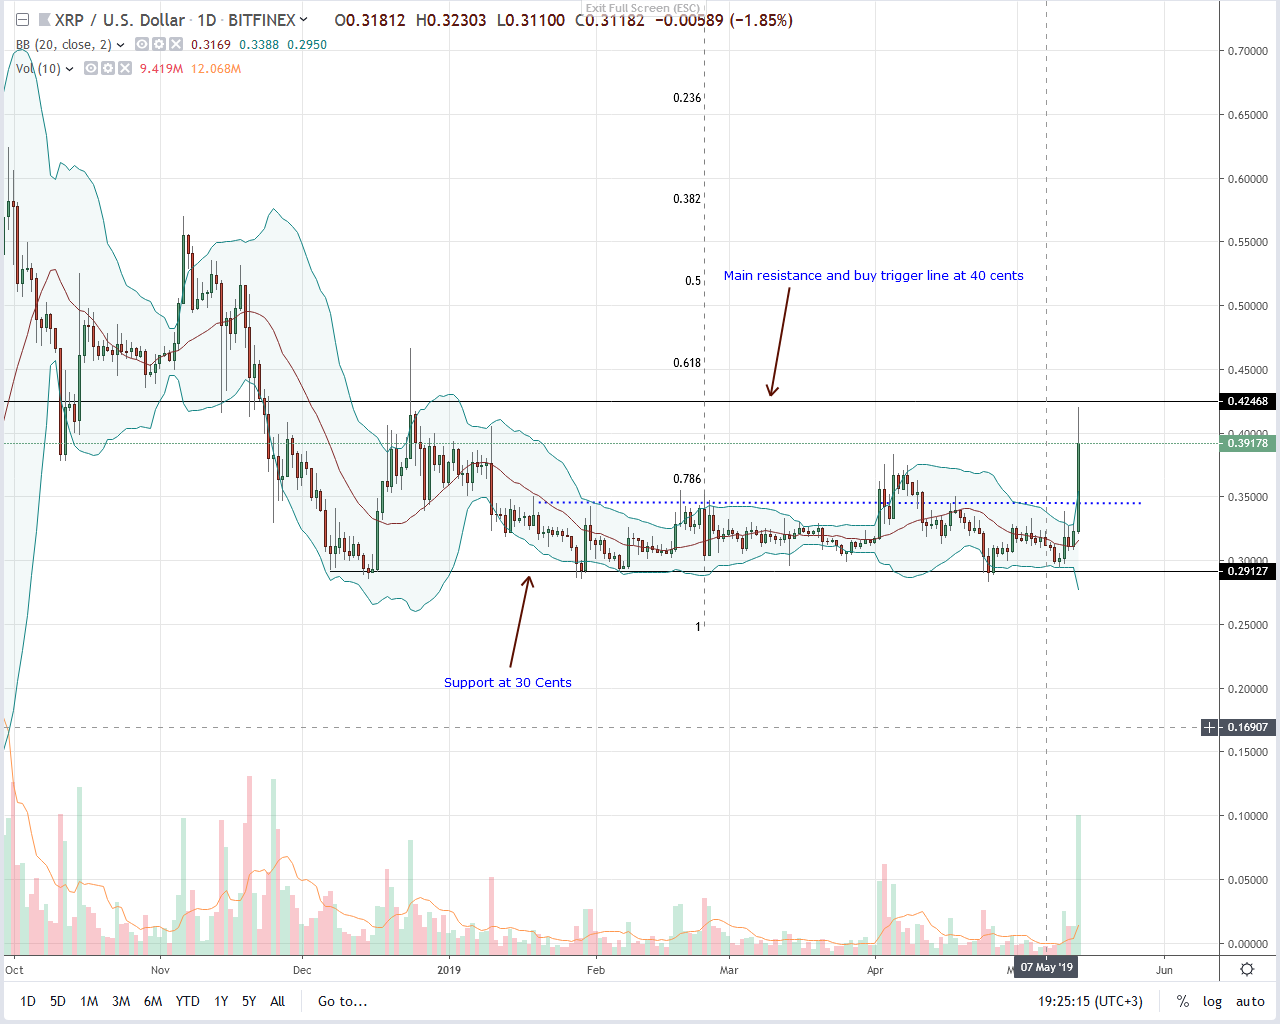
At spot rates, XRP is trading above 40 cents with a market cap of $18,076million,up 44.2 percent in the last week and closing on the ETH gap. Besides the injection of buy pressure, what’s worth noting is that prices are now trading above two critical resistance levels at the back of high participation levels.

Because of this sharp spike, all our XRP/USD trade conditions are right. As a result, the best course of action is to fine-tune entries in smaller time frames with the first modest target at 60 cents and later 80 cents.

On the flip side, in case there is a correction, ideal buy zones will be anywhere between 35 cents and 40 cents in a retest trade.

Technical Indicators
Since Sep 2018 bulls are back—analysis from an effort versus result point of view, supportive of buyers as prices are still consolidating inside Sep 2018 high low. Anchoring our trade is May-14 wide-ranging, bull bar with 187 million against 35 million. In a trend continuation, we expect XRP to close higher with equally high volumes ideally above 100 million.

source: https://www.newsbtc.com/2019/05/15/ripple-xrp-soar-up-44-2-percent-and-7-billion-away-from-flipping-eth/

13
Behind today’s 16.8 percent surge of Ethereum (ETH) prices are supportive fundamentals. Sources indicate that the CFTC is warming up to the idea of ETH derivatives and heavyweights are gravitating towards Ethereum. That is supporting prices, countering sell pressure emanating from Cryptopia liquidation.

Ethereum Price Analysis


Fundamentals
It’s over for Cryptopia, the New Zealand cryptocurrency exchange that was hacked, losing an estimated $16 million. Most of those lost coins were Ethereum (ETH) and related ERC tokens. With no haircuts, investors, as well as the exchange’s stakeholders, had to count losses severely affecting the liquidity position of the once vibrant exchange.

Unfortunately for traders and investors, the repercussions took a heavy toll, and the crypto exchange is now in liquidation. Grant Thornton New Zealand, the official liquidator, made the announcement which was subsequently confirmed by Cryptopia,  a few hours after the exchange went for unscheduled maintenance.

David Ruscoe representing the liquidator, said:

“We realize Cryptopia’s customers will want to have this matter resolved as soon as possible. We will conduct a thorough investigation, working with several different stakeholders, including management and shareholders, to find the solution that is in the best interests of customers and stakeholders.”

Candlestick Arrangement


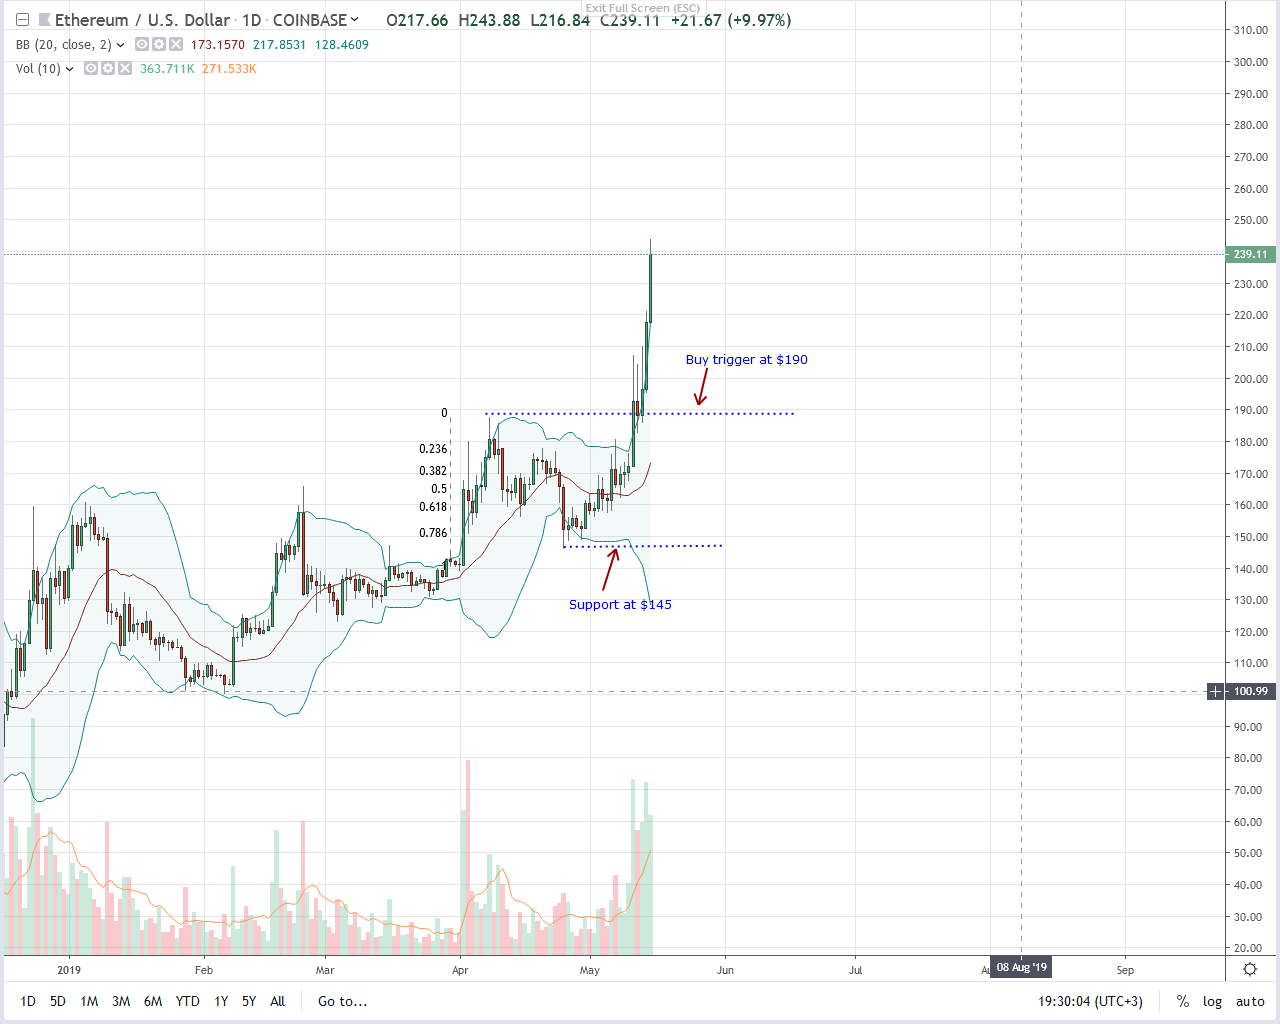
However, price action points at a different picture. Reflecting resilience–and an on-demand asset, the second most valuable coin is 40.3 percent in the last week. It’s up a massive 16.8 percent in the past 24 hours, matching the performance of Ripple (XRP) which is also on a solid uptrend.

In line with our last ETH/USD trade plan and development of the previous 24 hours, traders should fine-tune their positions in lower time frames as momentum build up. Already, hinting of underlying demand, bars are banding along the upper BB as it diverges from the 20-day MA.

Concurrently, ETH bulls are cementing their position above $200, and in a bull breakout pattern, it is likely that prices will expand towards $250, our first target and later $300. However, our ultimate aim stands at $450 or Q2 2018 lows.

Technical Indicator
Affirming our stance is increasing participation levels. From late Apr-2019, transaction volumes have more than doubled from around 100k to 242k of May-14. That is an express indication of demand, the perfect building blocks that will feed the next wave of higher highs first towards $250, $300 and later $450.

source: https://www.newsbtc.com/2019/05/15/ethereum-eth-bulls-rebuff-cryptopia-liquidation-race-to-450/

14
After their decision on Bitwise Bitcoin ETF, all eyes are on the US SEC and whether they will finally approve any of the many applications. Even so, buyers are in charge with prices soaring 70 percent after breaching $4,500 resistance, now support.

Bitcoin Price Analysis

Fundamentals
Over and above Satoshi’s objective of creating a global payment platform, Bitcoin is disruptive. The technology underpinning its success is likely to cause a paradigm shift accommodating fluid projects. Thus far, there is resistance—but for good reasons.

Bitcoin and all blockchain applications are global and mostly unregulated. That is why there is reluctance from institutional grade investors to sink funds into a sphere where asset price manipulation is so rampant that Jay Clayton of the SEC said the agency wouldn’t approve any crypto derivatives until there is proper monitoring in place.

As agencies and start-ups, lay down rails in compliance, Bitcoin benefits are seeping through barriers. While all eyes are on the SEC and whether they will give the green lights, other jurisdictions are reaping benefits from correctly classifying and assuring investors through capital tax gains. Malta is the lead, and Japan is setting the foundation while there are rumors that Russia is amassing Bitcoin and Gold as a cushion in case there is another sanction.

Meanwhile, Bakkt, Fidelity and traditional brokers are offering avenues for investment, meaning the future is all but bright for early entrants.

Candlestick Arrangement


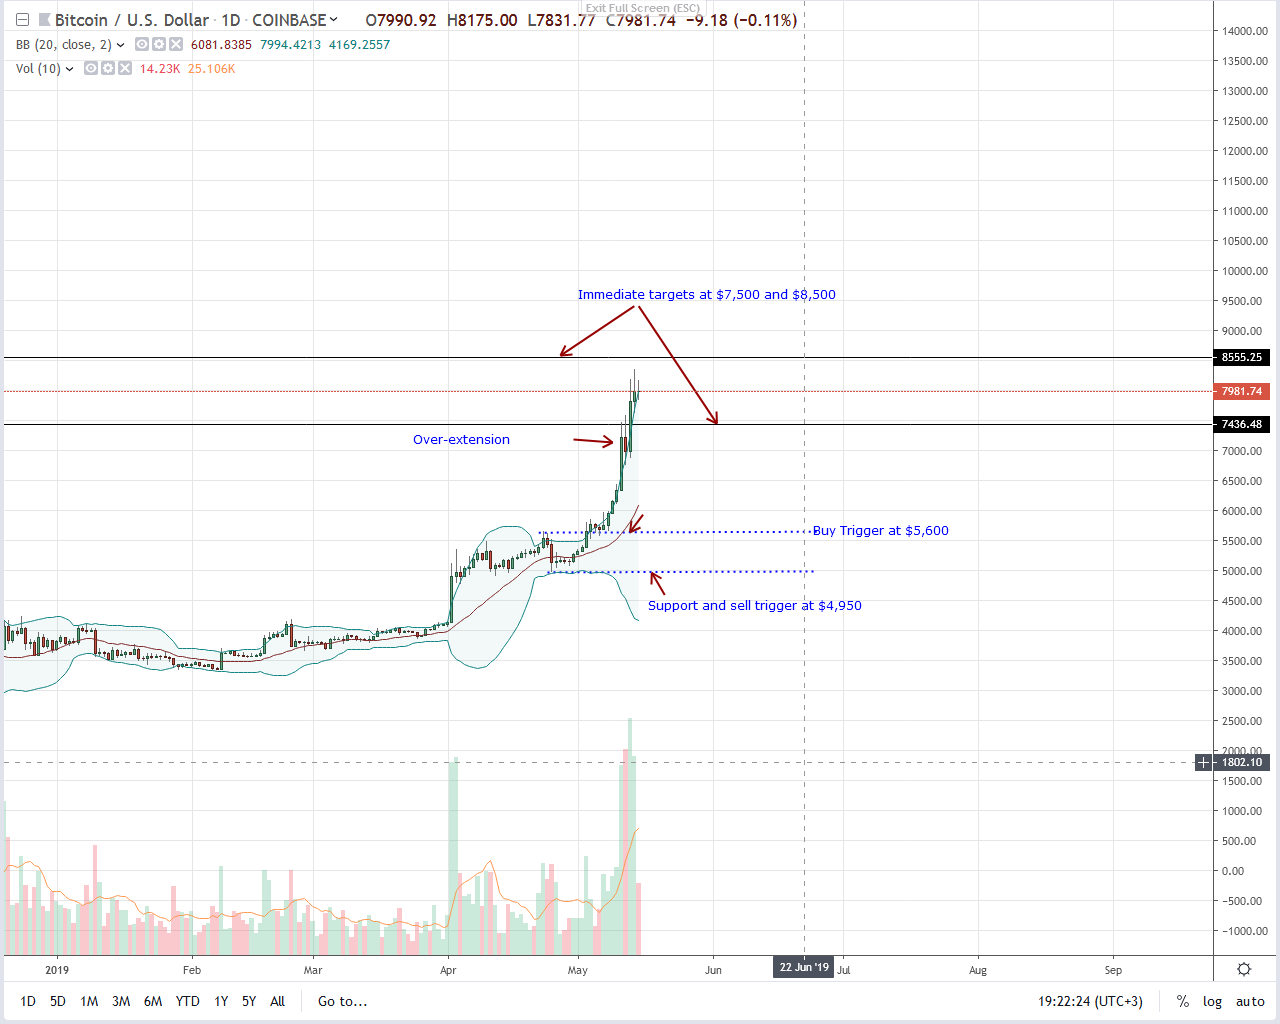
Price wise and Bitcoin (BTC) buyers are slowing down. After six weeks of stellar performance that saw BTC prices soar 70 percent—or more once bulls tore $4,500, the foundation is firm. Presently, BTC prices are under sell pressure. With yesterday’s long upper wick hinting of liquidation in lower time frames, today’s trade range is inside May-14 highs despite a near perpendicular expansion.

All the same, there is a high likelihood that buyers will forge forward. However, if there is a retracement from spot levels in a correction of May-14 over-valuation—a whole bull bar is above the upper BB, then prices would likely slide to $7,500 in a retest phase.

Nonetheless, from candlestick arrangement, buyers are firm and risk off traders should ramp up on dips, albeit with stops at around $7,600.

Technical Indicator
In light of this slow down and expectation of a retracement, our anchor bar is May-11’s. The candlestick is wide-ranging and with above average volumes—47k. For trend continuation, any breach of $8,500 or drop below $7,500 must be with high participation. These volumes must exceed averages of 24k and 47k confirming or nullifying our trade position.


source: https://www.newsbtc.com/2019/05/15/bitcoin-btc-capped-us-sec-delay-its-now-a-matter-of-when/

15
Ripple Price Analysis
Fundamentals
After five months of consolidation, Ripple (XRP) bulls are back—and with force. Trailing Bitcoin (BTC), XRP is the second top performing asset in the top-10, adding a massive 36.1 percent in the last week. However, the increasing volatility is timely for traders because it appears that Bitcoin—and most assets, are slowing down after six weeks of enormous gains. Behind today’s price spike is first, XRP changing hands cheaply. While Bitcoin and ETH are up upwards of 70 percent, XRP has been stable, tepid and ranging within 4 cents.

Additionally, the listing of Ripple (XRP) ETNs at Börse Stuttgart, the second largest regulated exchange in Germany and the ninth largest in Europe is noteworthy. Here’s what Jürgen Dietrich, Head of Trading at the exchange said:

“Interest in cryptocurrencies is still high. With the ETNs, investors in Germany can now for the first time through exchange-traded securities share in the performance of the major cryptocurrencies Litecoin and Ripple (XRP).”

However, there is more. There is a likelihood that the increasing tension between the US and China could see Wall Street sink channel funds to Ripple (XRP). The IMF has lauded the platform. Besides, Ripple Inc says they have a direct connection with the Trump administration, and they keep striking deals with banks.

Candlestick Arrangements


Price wise, Ripple (XRP) is up 25.7 percent in 24 hours, and because of that, bulls are back.

Not only is there is wide-ranging bull bar confirming buyers of Apr-26, but prices are trading above 34 cents complete with above average volumes meaning our XRP/USD trade plans are valid.

In that case, every dip, or retest of 34 cents, is but another buying opportunity with ideal targets at 40 cents, 60 cents and 80 cents as per our iterations.

Technical Indicators
From the chart, all our trade conditions are now correct. With today’s bar driving prices above 34 cents, triggering the first lot of XRP bulls complete with high volumes exceeding averages, bulls are in control and should load up on dips with targets as above.

source: https://www.newsbtc.com/2019/05/14/ripple-xrp-unshackled-at-this-rate-80-cents-is-inevitable/

Pages: [1] 2 3 ... 6
ETH & ERC20 Tokens Donations: 0x2143F7146F0AadC0F9d85ea98F23273Da0e002Ab
BNB & BEP20 Tokens Donations: 0xcbDAB774B5659cB905d4db5487F9e2057b96147F
BTC Donations: bc1qjf99wr3dz9jn9fr43q28x0r50zeyxewcq8swng
BTC Tips for Moderators: 1Pz1S3d4Aiq7QE4m3MmuoUPEvKaAYbZRoG
Powered by SMFPacks Social Login Mod