follow us on twitter . like us on facebook . follow us on instagram . subscribe to our youtube channel . announcements on telegram channel . ask urgent question ONLY . Subscribe to our reddit . Altcoins Talks Shop Shop


This is an Ad. Advertised sites are not endorsement by our Forum. They may be unsafe, untrustworthy, or illegal in your jurisdiction. Advertise Here

Author Topic: Daily Market Analysis By FXOpen  (Read 49315 times)

Offline FXOpen Trader

  • Hero Member
  • *
  • Activity: 851
  • points:
    52859
  • Karma: 0
  • Trade Count: (0)
  • Referrals: 0
  • Last Active: April 11, 2024, 12:55:29 PM
    • View Profile

  • Total Badges: 11
    Badges: (View All)
    Second year Anniversary 500 Posts One year Anniversary
Re: Daily Market Analysis By FXOpen
« Reply #285 on: October 20, 2022, 07:16:38 PM »
    ETHUSD and LTCUSD Technical Analysis – 20th OCT, 2022


    ETHUSD: Bullish Harami Pattern Above $1263

    Ethereum was unable to sustain its bearish momentum and after touching a low of 1205 on 13th Oct, the price started to correct upwards against the US dollar. The price of Ethereum touched a high of 1342 on 14th Oct after which we can see a shift towards the consolidation phase in the markets.

    We have seen a bullish opening of the markets which indicates the present bullish trend.

    We can clearly see a bullish harami pattern above the $1263 handle which signifies the end of a bearish phase and the start of a bullish phase in the markets.

    ETH is now trading just above its pivot level of 1291 and moving into a mildly bullish channel. The price of ETHUSD is now testing its classic resistance level of 1294 and Fibonacci resistance level of 1296 after which the path towards 1300 will get cleared.

    The relative strength index is at 47 indicating a neutral demand for Ether and a shift towards consolidation phase in the markets.

    We can see that the Williams percent range is back over -50 indicating the bullish tone present in the markets.

    The STOCHRSI is indicating an overbought market, which means that the price is expected to decline in the short-term range.

    Some of the technical indicators are giving a STRONG BUY market signal.

    Some of the moving averages are giving a BUY signal and we are now looking at the levels of $1350 to $1400 in the short-term range.

    ETH is now trading below both the 100 & 200 hourly simple and exponential moving averages.

    [LIST=1]
    • Ether: bullish reversal seen above the $1263 mark
    • Short-term range appears to be mildly bullish
    • ETH continues to remain above the $1200 level
    • The average true range is indicating LESS market volatility

    Ether: Bullish Reversal Seen Above $1263


    ETHUSD is now moving into a mildly bullish channel with the price trading above the $1200 handle in the European trading session today.

    ETH touched an intraday low of 1271 in the Asian trading session and an intraday high of 1294 in the European trading session today.

    We can see the formation of a bullish harami pattern in the weekly time frame.

    The commodity channel index is indicating a neutral level and fresh upsides are expected in the markets towards the 1300 handle.

    Ethereum’s price continues to move into a bullish zone against the US dollar and is expected to move above the $1300 levels.

    The daily RSI is printing at 43 indicating a weak demand in the long-term range.

    The key support levels to watch are $1232 and $1251, and the price of ETHUSD needs to remain above these levels for the continuation of the bullish reversal in the markets.

    ETH has decreased by 0.40% with a price change of 5.16$ in the past 24hrs and has a trading volume of 8.465 billion USD.

    We can see a decrease of 15.87% in the total trading volume in the last 24 hrs which appears to be normal.

    The Week Ahead

    The price of Ethereum continues to remain well supported above the $1200 level, and has now started to move higher aiming at the $1300 level.

    We can see the formation of a major bullish trend line in place from $1263 towards $1359 levels.

    The immediate short-term outlook for Ether has turned mildly bullish, the medium-term outlook has turned neutral, and the long-term outlook for Ether is neutral in present market conditions.

    The price of ETHUSD will need to remain above the important support level of $1273 which is a 38.2% retracement from 4-week low.

    The weekly outlook is projected at $1400 with a consolidation zone of $1375.

    Technical Indicators:

    The average directional index ADX (14): is at 35.00 indicating a BUY

    The ultimate oscillator: is at 69.59 indicating a BUY

    Bull/bear power (13): is at 3.83 indicating a BUY

    The commodity channel index (14): is at 59.91 indicating a BUY

    VIEW FULL ANALYSIS VISIT - FXOpen Blog...

    Disclaimer: CFDs are complex instruments and come with a high risk of losing your money.

    Altcoins Talks - Cryptocurrency Forum

    Re: Daily Market Analysis By FXOpen
    « Reply #285 on: October 20, 2022, 07:16:38 PM »

    This is an Ad. Advertised sites are not endorsement by our Forum. They may be unsafe, untrustworthy, or illegal in your jurisdiction. Advertise Here


    Offline FXOpen Trader

    • Hero Member
    • *
    • Activity: 851
    • points:
      52859
    • Karma: 0
    • Trade Count: (0)
    • Referrals: 0
    • Last Active: April 11, 2024, 12:55:29 PM
      • View Profile

    • Total Badges: 11
      Badges: (View All)
      Second year Anniversary 500 Posts One year Anniversary
    Re: Daily Market Analysis By FXOpen
    « Reply #286 on: October 22, 2022, 02:52:07 PM »
    Watch FXOpen's October 17-21 Weekly Market Wrap Video

    In this video, FXOpen UK COO Gary Thomson sums up the week’s happenings and discusses the most significant news reports.

    • Semiconductor war between China and the US
    • The US puts pressure on the price of oil
    • UK inflation officially goes over 10%
    • How UK’s political drama is affecting financial markets

    Watch our short and informative video, and stay updated with FXOpen.


    FXOpen YouTube

    Disclaimer: CFDs are complex instruments and come with a high risk of losing your money.

    Offline FXOpen Trader

    • Hero Member
    • *
    • Activity: 851
    • points:
      52859
    • Karma: 0
    • Trade Count: (0)
    • Referrals: 0
    • Last Active: April 11, 2024, 12:55:29 PM
      • View Profile

    • Total Badges: 11
      Badges: (View All)
      Second year Anniversary 500 Posts One year Anniversary
    Re: Daily Market Analysis By FXOpen
    « Reply #287 on: October 25, 2022, 02:52:43 PM »
    BTCUSD and XRPUSD Technical Analysis – 25th OCT 2022


    BTCUSD: Bearish Engulfing Pattern Below $19685

    Bitcoin was unable to sustain its bullish momentum and after touching a high of 19694 on 18th Oct, it started to decline touching a low of 18718 on 21st Oct.

    We can see that bitcoin has made a failed attempt to cross the $20500 resistance on two separate occasions this month and is now back in the bearish zone.

    We can see the formation of a bearish price crossover pattern with adaptive moving average AMA 20 and AMA 100 in the 4-hour time frame.

    We can clearly see a bearish engulfing pattern below the $19685 handle which is a bearish reversal pattern because it signifies the end of an uptrend and a shift towards a downtrend.

    Bitcoin touched an intraday low of 19252 in the Asian trading session and an intraday high of 19372 in the European trading session today.

    Both the STOCH and Williams percent range are indicating overbought levels which means that in the immediate short term, a decline in the prices is expected.

    The relative strength index is at 44 indicating a WEAKER demand for bitcoin, and the continuation of the selling pressure in the markets.

    Bitcoin is now moving above its 100 hourly simple moving average and above its 200 hourly exponential moving averages.

    Some of the major technical indicators are giving a SELL signal, which means that in the immediate short term, we are expecting targets of 19000 and 18500.

    The average true range is indicating LESS market volatility with a mildly bearish momentum.

    • Bitcoin: bearish reversal seen below $19685
    • The STOCHRSI is indicating an oversold level
    • The price is now trading just below its pivot level of $19355
    • Some of the moving averages are giving a SELL market signal

    Bitcoin: Bearish Reversal Seen Below $19685


    We can now see the progression of a falling trend channel in bitcoin as it is unable to hold onto its gains, and the increase in the selling pressure suggest we are now moving towards the $18000 handle.

    The Aroon indicator is giving a bearish trend signal in the 1-hour time frame.

    The MACD indicator is back under zero indicating the bearish trend in the 15-minute time frame.

    The RSI indicator is also back under 50 indicating the weakness present in the markets.

    The immediate short-term outlook for bitcoin is mildly bearish, the medium-term outlook has turned bearish, and the long-term outlook remains neutral under present market conditions.

    Bitcoin’s support zone is located at $18577, the Camarilla support levels and the price needs to remain above this level for any potential of the bullish reversal in the markets.

    The price of BTCUSD is now facing its classic support level of 19303 and Fibonacci resistance level of 19343 after which the path towards 18500 will get cleared.

    In the last 24hrs, BTCUSD has decreased by 0.03% by 5$ and has a 24hr trading volume of USD 26.294 billion. We can see a decrease of 4.13% in the trading volume compared to yesterday, which appears to be normal.

    The Week Ahead

    The price of bitcoin is moving in a mildly bearish zone below the $19500 level. Further downside is projected at $18500 and $18000 as the immediate targets.

    We have seen a bearish opening of the markets which suggests that we are poised for further declines this week below the $19000 levels.

    The daily RSI is printing at 48 which indicates a neutral level and a move towards the consolidation phase in the markets.

    The price of BTCUSD will need to remain above the important support level of $18000 this week.

    The weekly outlook is projected at $18500 with a consolidation zone of $18000.

    Technical Indicators:

    The moving Averages Convergence Divergence MACD (12,26): is at -5.20 indicating a SELL

    The commodity channel index CCI (14): is at -80.22 indicating a SELL

    The rate of price change ROC: is at -0.16 indicating a SELL

    The bull/bear power (13): is at 3-38.49 indicating a SELL

    VIEW FULL ANALYSIS VISIT - FXOpen Blog...

    Disclaimer: CFDs are complex instruments and come with a high risk of losing your money.

    Offline FXOpen Trader

    • Hero Member
    • *
    • Activity: 851
    • points:
      52859
    • Karma: 0
    • Trade Count: (0)
    • Referrals: 0
    • Last Active: April 11, 2024, 12:55:29 PM
      • View Profile

    • Total Badges: 11
      Badges: (View All)
      Second year Anniversary 500 Posts One year Anniversary
    Re: Daily Market Analysis By FXOpen
    « Reply #288 on: October 27, 2022, 08:19:47 PM »
    ETHUSD and LTCUSD Technical Analysis – 27th OCT, 2022


    ETHUSD: Inverted Hammer Pattern Above $1254

    Ethereum was unable to sustain its bearish momentum and after touching a low of 1254 on 21st Oct, the prices started to correct upwards against the US dollar. The prices of Ethereum touched a high of 1593 on 26th Oct after which we can see a shift towards the consolidation phase in the markets.

    We can see that the prices of Ethereum are ranging near the support of the triangle in the 15-minute time frame indicating the bullish overtone of the markets.

    We can clearly see an inverted hammer pattern above the $1254 handle which is a bullish pattern and signifies the end of a bearish phase and the start of a bullish phase in the markets.

    ETH is now trading just below its pivot level of 1554 and is moving into a mildly bullish channel. The price of ETHUSD is now testing its classic resistance levels of 1568 and Fibonacci resistance levels of 1583 after which the path towards 1600 will get cleared.

    The relative strength index is at 75 indicating an overbought market and the shift towards the correction and consolidation phase in the markets.

    We can see that the commodity channel index is giving a bullish divergence signal in the 30-minute time frame.

    Both the STOCH and Williams percent range are indicating an overbought market, which means that the prices are expected to decline in the short-term range.

    Some of the technical indicators are giving a STRONG BUY market signal.

    Some of the moving averages are giving a BUY signal, and we are now looking at the levels of $1650 to $1700 in the short-term range.

    ETH is now trading above both the 100 & 200 hourly simple and exponential moving averages.

    • Ether: bullish reversal seen above the $1254 mark
    • The short-term range appears to be mildly bullish
    • ETH continues to remain above the $1500 level
    • The average true range is indicating HIGH market volatility

    Ether: Bullish Reversal Seen Above $1254


    ETHUSD is now moving into a mildly bullish channel with the price trading above the $1500 handle in the European trading session today.

    ETH touched an intraday high of 1583 in the Asian trading session and an intraday low of 1536 in the European trading session today.

    The parabolic SAR indicator is giving a bullish reversal signal in the weekly time frame.

    Moving average bullish crossovers are seen: AMA20 and AMA50 in the daily timeframe.

    We can also see the formation of a bullish price crossover pattern with moving average MA20 in the weekly time frame.

    Ethereum’s price continues to move into a bullish zone against the US dollar and is expected to move above the $1600 level.

    The daily RSI is printing at 69 indicating a very strong demand for Ether in the long-term range.

    The key support levels to watch are $1392 which is a 50% retracement from a 4-week low and 1439 which is a 38.2% retracement from 4-week high.

    ETH has increased by 0.74% with a price change of 11.43$ in the past 24hrs and has a trading volume of 26.649 billion USD.

    We can see a decrease of 29.89% in the total trading volume in the last 24 hrs which is due to the shift towards the consolidation phase in the markets.

    The Week Ahead

    After the recent declines, Ethereum’s price is extending upwards correction against the US dollar and bitcoin. We are now looking for a fresh rally into the markets towards the $1800 level.

    We can see the formation of a major bullish trend line in place from $1254 towards $1745 level.

    The immediate short-term outlook for Ether has turned mildly bullish, the medium-term outlook has turned neutral, and the long-term outlook for Ether is neutral in present market conditions.

    The price of ETHUSD will need to remain above the important support levels of $1473 — 1273 which is a pivot point 1st support point.

    The weekly outlook is projected at $1700 with a consolidation zone of $1600.

    Technical Indicators:

    The average directional index ADX (14): is at 42.29 indicating a BUY

    The ultimate oscillator: is at 61.39 indicating a BUY

    The bull/bear power (13): is at 126.52 indicating a BUY

    The commodity channel index (14): is at 81.21 indicating a BUY

    VIEW FULL ANALYSIS VISIT - FXOpen Blog...

    Disclaimer: CFDs are complex instruments and come with a high risk of losing your money.

    Offline FXOpen Trader

    • Hero Member
    • *
    • Activity: 851
    • points:
      52859
    • Karma: 0
    • Trade Count: (0)
    • Referrals: 0
    • Last Active: April 11, 2024, 12:55:29 PM
      • View Profile

    • Total Badges: 11
      Badges: (View All)
      Second year Anniversary 500 Posts One year Anniversary
    Re: Daily Market Analysis By FXOpen
    « Reply #289 on: October 29, 2022, 12:43:44 PM »
    Watch FXOpen's October 24-28 Weekly Market Wrap Video

    In this video, FXOpen UK COO Gary Thomson sums up the week’s happenings and discusses the most significant news reports.

    • How will Rishi Sunak affect the pound?
    • EUR/USD gathers pace
    • Big Tech hit by fears of potential recession
    • META (FB) shares fall 20% after earnings report

    Watch our short and informative video, and stay updated with FXOpen.


    FXOpen YouTube

    Disclaimer: CFDs are complex instruments and come with a high risk of losing your money.

    Offline FXOpen Trader

    • Hero Member
    • *
    • Activity: 851
    • points:
      52859
    • Karma: 0
    • Trade Count: (0)
    • Referrals: 0
    • Last Active: April 11, 2024, 12:55:29 PM
      • View Profile

    • Total Badges: 11
      Badges: (View All)
      Second year Anniversary 500 Posts One year Anniversary
    Re: Daily Market Analysis By FXOpen
    « Reply #290 on: November 01, 2022, 07:57:40 PM »
    BTCUSD and XRPUSD Technical Analysis – 01st NOV 2022


    BTCUSD: Inverted Hammer Pattern Above $19187

    Bitcoin was unable to sustain its bearish momentum and after touching a low of 19187 on 24th Oct, the prices started to correct upwards crossing the $20500 handle.

    We can see continued appreciation in the price of BTCUSD which is now trading above the 20500 in the European trading session today.

    We can see the formation of a bullish harami pattern in the 30-minute time frame.

    The resistance of the channel is broken in the 1-hourly time frame indicating the bullish tone of the markets.

    We can clearly see an inverted hammer pattern above the $19187 handle which is a bullish reversal pattern because it signifies the end of a downtrend and a shift towards an uptrend.

    Bitcoin touched an intraday low of 20379 in the Asian trading session and an intraday high of 20657 in the European trading session today.

    Both the STOCH and STOCHRSI are indicating overbought levels which means that in the immediate short term, a decline in the price is expected.

    The relative strength index is at 53 indicating a NEUTRAL demand for bitcoin and a shift towards the consolidation phase in the markets.

    Bitcoin is now moving above its 100 hourly exponential moving average and above its 200 hourly exponential moving averages.

    Most of the major technical indicators are giving a STRONG BUY signal, which means that in the immediate short term, we are expecting targets of 21000 and 21500.

    The average true range is indicating LESS market volatility with a mildly bullish momentum.

    • Bitcoin: bullish reversal seen above $19187.
    • The Williams percent range is indicating an overbought level.
    • The price is now trading just below its pivot level of $20607.
    • Most of the moving averages are giving a STRONG BUY market signal.

    Bitcoin: Bullish Reversal Seen Above $19187


    We can now see that the price of bitcoin rocketed higher recently towards the monthly high of 20969 on 29th Oct, and we can now witness the formation of an ascending channel in the markets.

    Bitcoin’s price is super bullish against the US dollar and bitcoin and now we are aiming towards crossing the $21000 and $22000 levels soon.

    The adaptive moving average AMA20 and AMA50 are giving a bullish trend reversal signal.

    The price of bitcoin is back over the pivot point in the daily time frame indicating the bullish overtone present in the markets.

    We have also seen a bullish opening of the markets this week.

    The immediate short-term outlook for bitcoin is strongly bullish, the medium-term outlook has turned bullish, and the long-term outlook remains neutral under present market conditions.

    Bitcoin’s support zone is located at $19637 which is a 50% retracement from a 4-week high/low and the price needs to remain above this level for the continuation of the bullish reversal in the markets.

    The price of BTCUSD is now facing its classic resistance level of 20628 and Fibonacci resistance level of 20667 after which the path towards 21500 will get cleared.

    In the last 24hrs, BTCUSD has increased by 0.25% by 51$ and has a 24hr trading volume of USD 45.266 billion. We can see an increase of 39.05% in the trading volume compared to yesterday, which is due to the heavy buying pressure seen in the global markets.

    The Week Ahead

    The price of bitcoin is moving in a strongly bullish zone above the $20500 levels. Further upsides are projected at $21500 and $22000 as the immediate targets.

    Now we are aiming for $21710 which is a 50% retracement from 13 week high/low.

    The daily RSI is printing at 59 which indicates a strong demand for bitcoin and the continuation of the buying pressure in the markets.

    The price of BTCUSD will need to remain above the important support level of $20000 this week.

    The weekly outlook is projected at $21500 with a consolidation zone of $22000.

    Technical Indicators:

    The moving averages convergence divergence MACD (12,26): is at 6.20 indicating a BUY.

    The commodity channel index CCI (14): is at 138.28 indicating a BUY.

    The rate of price change ROC: is at 1.22 indicating a BUY.

    Bull/bear power (13): is at 128.67 indicating a BUY.

    VIEW FULL ANALYSIS VISIT - FXOpen Blog...

    Disclaimer: CFDs are complex instruments and come with a high risk of losing your money.


    Offline FXOpen Trader

    • Hero Member
    • *
    • Activity: 851
    • points:
      52859
    • Karma: 0
    • Trade Count: (0)
    • Referrals: 0
    • Last Active: April 11, 2024, 12:55:29 PM
      • View Profile

    • Total Badges: 11
      Badges: (View All)
      Second year Anniversary 500 Posts One year Anniversary
    Re: Daily Market Analysis By FXOpen
    « Reply #291 on: November 03, 2022, 03:21:56 PM »
    ETHUSD and LTCUSD Technical Analysis – 03rd NOV, 2022


    ETHUSD: Bullish Engulfing Pattern Above $1483

    Ethereum was unable to sustain its bearish momentum and after touching a low of 1488 on 28th Oct, the prices started to correct upwards against the US dollar. The prices of Ethereum touched a high of 1642 on 29th Oct after which we can see a shift towards the consolidation phase in the markets.

    We can see that the MACD indicator is giving a bullish divergence signal in the 4-hour time frame

    We can clearly see a bullish engulfing pattern above the $1483 handle which is a bullish pattern and signifies the end of a bearish phase and the start of a bullish phase in the markets.

    ETH is now trading just above its pivot level of 1544 and is moving into a mildly bullish channel. The price of ETHUSD is now testing its classic resistance levels of 1548 and Fibonacci resistance level of 1552 after which the path towards 1600 will get cleared.

    The relative strength index is at 48 indicating a neutral market and the shift towards a correction and consolidation phase in the markets.

    We can see that the commodity channel index is giving a neutral signal which indicates a range bound movement for some time in the markets.

    The STOCHRSI is indicating an overbought market, which means that the prices are expected to decline in the short-term range.

    Some of the technical indicators are giving a BUY market signal.

    Some of the moving averages are giving a BUY signal and we are now looking at the levels of $1650 to $1700 in the short-term range.

    ETH is now trading below both its 100 & 200 hourly simple and exponential moving averages.

    • Ether: bullish reversal seen above the $1483 mark
    • The short-term range appears to be mildly bullish
    • ETH continues to remain above the $1500 levels
    • The average true range is indicating LESS market volatility

    Ether: Bullish Reversal Seen Above $1254


    ETHUSD is now moving into a mildly bullish channel with the prices trading above the $1500 handle in the European trading session today.

    ETH touched an intraday low of 1502 in the Asian trading session and an intraday low of 1558 in the European trading session today.

    The RSI indicator is back over 50 indicating a bullish scenario.

    We can see a bullish price crossover pattern with moving averages MA20 and MA100.

    We can also see the formation of a bullish harami pattern in both the 2-hour and 4-hour time frames.

    The MA20 is also indicating a bullish trend reversal signal in the weekly timeframe.

    The daily RSI is printing at 60 indicating a strong demand for Ether in the long-term range.

    The key support level to watch is $1427 which is a 50% retracement from a 4-week high/low and 1482 which is a 38.2% retracement from 4 week high/low.

    ETH has decreased by 0.70% with a price change of 11.14$ in the past 24hrs and has a trading volume of 22.835 billion USD.

    We can see an increase of 53.42% in the total trading volume in the last 24 hrs which is due to the continued buying seen at lower levels.

    The Week Ahead

    ETH price continues to remain in a bullish zone against the US dollar and bitcoin. ETHUSD is expected to move higher towards the $1600 and $1700 levels this week.

    We can see the formation of a major bullish trendline in place from $1483 towards $1640 level.

    The immediate short-term outlook for Ether has turned mildly bullish, the medium-term outlook has turned neutral, and the long-term outlook for Ether is neutral at present market conditions.

    The prices of ETHUSD will need to remain above the important support level of $1513 which is a 38.2% retracement from 13-week low.

    Weekly outlook is projected at $1750 with a consolidation zone of $1650.

    Technical Indicators:

    The STOCH (9,6): is at 77.85 indicating a BUY.

    The rate of price change: is at 0.983 indicating a BUY.

    The bull/bear power (13): is at 4.55 indicating a BUY.

    High/lows(14): is at 9.01 indicating a BUY.

    VIEW FULL ANALYSIS VISIT - FXOpen Blog...

    Disclaimer: CFDs are complex instruments and come with a high risk of losing your money.

    Altcoins Talks - Cryptocurrency Forum

    Re: Daily Market Analysis By FXOpen
    « Reply #291 on: November 03, 2022, 03:21:56 PM »


    Offline FXOpen Trader

    • Hero Member
    • *
    • Activity: 851
    • points:
      52859
    • Karma: 0
    • Trade Count: (0)
    • Referrals: 0
    • Last Active: April 11, 2024, 12:55:29 PM
      • View Profile

    • Total Badges: 11
      Badges: (View All)
      Second year Anniversary 500 Posts One year Anniversary
    Re: Daily Market Analysis By FXOpen
    « Reply #292 on: November 05, 2022, 10:01:46 PM »
    Watch FXOpen's October 31 - November 4 Weekly Market Wrap Video

    In this video, FXOpen UK COO Gary Thomson sums up the week’s happenings and discusses the most significant news reports.

    • FTSE 100 rockets as oil giant reaps the profits
    • The Fed shook the market. What's next?
    • UK Interest Rate announcement
    • Will the Oil price rise?

    Watch our short and informative video, and stay updated with FXOpen.


    https://www.youtube.com/c/FXOpenOfficial[/youtube]"]FXOpen YouTube[/B]

    Disclaimer: CFDs are complex instruments and come with a high risk of losing your money.

    Offline FXOpen Trader

    • Hero Member
    • *
    • Activity: 851
    • points:
      52859
    • Karma: 0
    • Trade Count: (0)
    • Referrals: 0
    • Last Active: April 11, 2024, 12:55:29 PM
      • View Profile

    • Total Badges: 11
      Badges: (View All)
      Second year Anniversary 500 Posts One year Anniversary
    Re: Daily Market Analysis By FXOpen
    « Reply #293 on: November 08, 2022, 09:19:25 PM »
    BTCUSD and XRPUSD Technical Analysis – 08th NOV 2022


    BTCUSD: Shooting Star Pattern Below $21470

    Bitcoin was unable to sustain its bullish momentum and after touching a high of 21470 on 05th Nov, the price started to correct lower against the US dollar and is now trading below the $20000 handle in the European trading session.

    We can see that the price is declining due to heavy selling pressure seen across the global crypto markets, and the price of bitcoin is expected to break below the $19000 handle this week.

    We have seen a bearish opening of the markets this week.

    We can see the formation of bearish engulfing lines in the 1-hour time frame.

    The price of bitcoin is below the pivot point and camarilla S3 support level, indicating the bearish trends present in the market.

    We can clearly see a shooting star pattern below the $21470 handle which is a bearish reversal pattern because it signifies the end of an uptrend and a shift towards a downtrend.

    Bitcoin touched an intraday high of 20666 and an intraday low of 19413 in the Asian trading session today.

    Both the STOCH and Williams percent range are indicating overbought levels which means that in the immediate short term, a decline in the prices is expected.

    The relative strength index is at 27 indicating a VERY WEAK demand for bitcoin, and the continuation of selling pressure in the markets.

    Bitcoin is now moving below its 100 hourly exponential moving average and above its 200 hourly exponential moving average.

    Most of the major technical indicators are giving a STRONG SELL signal, which means that in the immediate short term, we are expecting targets of 19000 and 18500.

    The average true range is indicating HIGH market volatility with a strong bearish momentum.

    • Bitcoin: bearish reversal seen below $21470
    • The STOCHRSI range is indicating an oversold level
    • The price is now trading below its pivot level of $19818
    • Most of the moving averages are giving a STRONG SELL market signal

    Bitcoin: Bearish Reversal Seen Below $21470


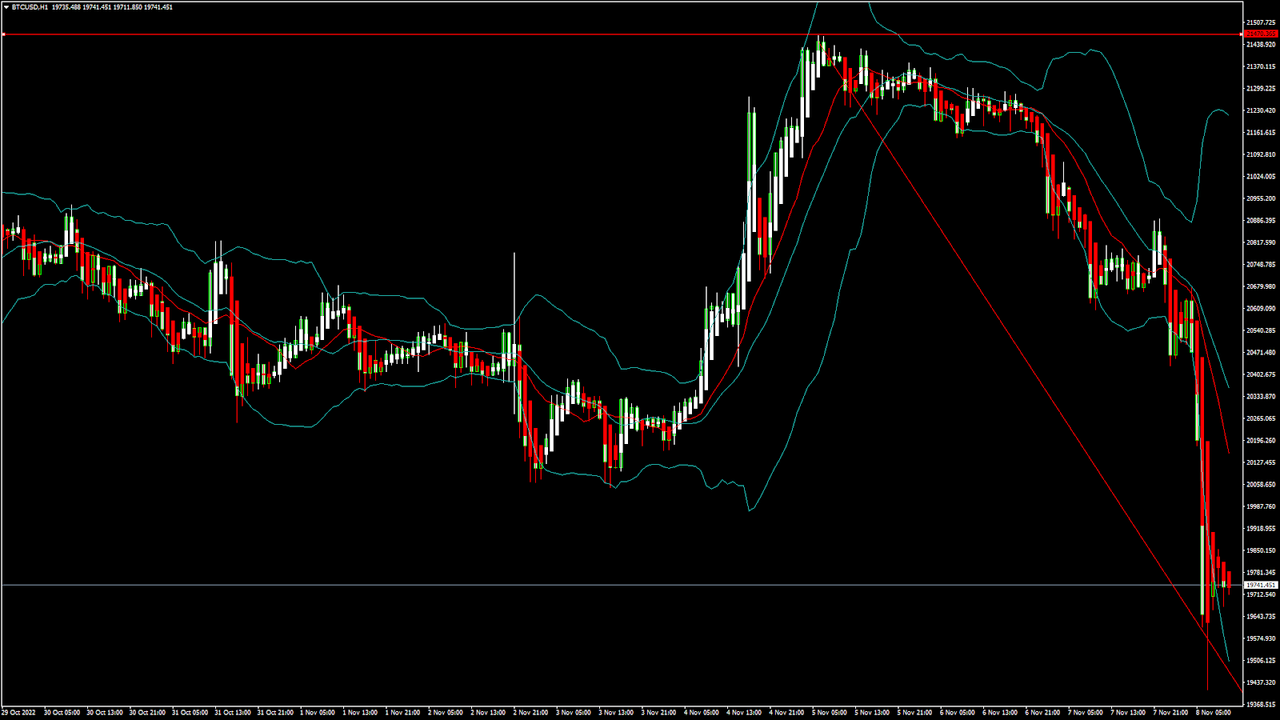
    We can now see that the price of bitcoin failed to clear the $22000 handle and is now moving towards the $19000 level.

    The MACD has crossed down its moving average in the daily time frame indicating a bearish trend.

    The parabolic SAR indicator is giving a bearish reversal signal in the daily time frame.

    We can see the formation of a bearish price crossover pattern with adaptive moving average AMA20 and AMA50 in the daily time frame.

    We have also seen a black evening star in the weekly time frame.

    The immediate short-term outlook for bitcoin is strongly bearish, the medium-term outlook has turned bearish, and the long-term outlook remains neutral under present market conditions.

    Bitcoin’s support zone is located at $19475 which is a 38.2% retracement from a 4 week low, and the price needs to remain above these levels for any potential bullish reversal in the markets.

    The price of BTCUSD is now facing its classic support level of 19646 and Fibonacci resistance level of 19700 after which the path towards 19000 will get cleared.

    In the last 24hrs, BTCUSD has decreased by 4.68% by 970$ and has a 24hr trading volume of USD 66.898 billion. We can see an increase of 51.65% in the trading volume compared to yesterday, which is due to the heavy selling pressure seen in the global markets.

    The Week Ahead

    The price of Bitcoin is moving in a strongly bearish zone below the $20000 level. Further downsides are projected at $19000 and $18500 as the immediate targets.

    Now we are aiming for $19385which is an 18-day moving average.

    The daily RSI is printing at 45 which indicates a neutral demand for bitcoin and a shift towards the consolidation phase in the markets.

    The price of BTCUSD has already crossed below $19855 which is a 50% retracement from a 4-week high/low.

    The weekly outlook is projected at $19000 with a consolidation zone of $19250.

    Technical Indicators:

    The moving averages convergence divergence MACD (12, 26): is at -303.10 indicating a SELL

    The commodity channel index CCI (14): is at -107.49 indicating a SELL

    The rate of price change ROC: is at -4.53 indicating a SELL

    The bull/bear power (13): is at -775.38 indicating a SELL

    VIEW FULL ANALYSIS VISIT - FXOpen Blog...

    Disclaimer: CFDs are complex instruments and come with a high risk of losing your money.

    Offline FXOpen Trader

    • Hero Member
    • *
    • Activity: 851
    • points:
      52859
    • Karma: 0
    • Trade Count: (0)
    • Referrals: 0
    • Last Active: April 11, 2024, 12:55:29 PM
      • View Profile

    • Total Badges: 11
      Badges: (View All)
      Second year Anniversary 500 Posts One year Anniversary
    Re: Daily Market Analysis By FXOpen
    « Reply #294 on: November 10, 2022, 10:33:02 PM »
    ETHUSD and LTCUSD Technical Analysis – 10th NOV, 2022


    ETHUSD: Hammer Pattern Above $1072

    Ethereum was unable to sustain its bullish momentum, and after touching a high of 1654 on 05th Nov, the price started to decline against the US dollar touching a low of 1079 on 10th Nov, 2022.

    Today we can see some upwards correction in the price of Ethereum which has touched $1200 handle in the European trading session.

    We have seen a bullish opening of the markets this week.

    We can clearly see a hammer pattern above the $1072 handle which is a bullish pattern and signifies the end of a bearish phase and the start of a bullish phase in the markets.

    ETH is now trading just below its pivot level of 1203 and moving into a mildly bullish channel. The price of ETHUSD is now testing its classic resistance level of 1230 and Fibonacci resistance level of 1246 after which the path towards 1300 will get cleared.

    The relative strength index is at 47 indicating a neutral market and a shift towards the correction and consolidation phase in the markets.

    We can see that the price is back over the pivot point indicating a bullish scenario in the daily time frame.

    The STOCHRSI is indicating an overbought market, which means that the prices are expected to decline in the short-term range.

    Most of the technical indicators are giving a BUY market signal.

    Some of the moving averages are giving a BUY signal and we are now looking at the levels of $1350 to $1400 in the short-term range.

    ETH is now trading below both the 100 & 200 hourly simple and exponential moving averages.

    • Ether: bullish reversal seen above the $1072 mark
    • Short-term range appears to be mildly bullish
    • ETH continues to remain above the $1100 level
    • The average true range is indicating LESS market volatility

    Ether: Bullish Reversal Seen Above $1072


    ETHUSD is now moving into a mildly bullish channel with the price trading above the $1150 handle in the European trading session today.

    ETH touched an intraday low of 1127 in the Asian trading session and an intraday high of 1217 in the European trading session today.

    We can see a bullish trend reversal signal with moving average MA50 in the 15-minute time frame.

    Some of the technical indicators still continue to give bearish signals including the rate of price change.

    The price of Ethereum is marching towards a nullish zone against the US dollar and bitcoin. ETHUSD could continue to move higher back towards the $1400 level.

    The daily RSI is printing at 36 indicating a very weak demand for Ether in the long-term range.

    The key support levels to watch are $1077 which is a 1-month low, and 1184 which is a pivot point.

    ETH has increased by 1.79% with a price change of 20.91$ in the past 24hrs and has a trading volume of 36.854 billion USD.

    We can see a decrease of 13.76% in the total trading volume in the last 24 hrs which appears to be normal.

    The Week Ahead

    The price of ETH continues to remain in a bullish zone against the US dollar and bitcoin. ETHUSD is expected to move higher towards the $1300 and $1400 levels this week.

    On the upside, we are now looking at the immediate targets of 1303 which is a 38.2% retracement from a 4-week low, and 1372 which is a 50% retracement from 4-week high/low.

    The immediate short-term outlook for Ether has turned mildly bullish, the medium-term outlook has turned neutral, and the long-term outlook for Ether is neutral in present market conditions.

    The price of ETHUSD will need to remain above the important support levels of $1188 which is the last support point.

    The weekly outlook is projected at $1450 with a consolidation zone of $1350.

    Technical Indicators:

    The average directional index ADX (14): is at 37.20 indicating a BUY

    The rate of price change: is at 3.057 indicating a BUY

    The bull/bear power (13): is at 37.90 indicating a BUY

    High/lows (14): is at 25.17 indicating a BUY

    VIEW FULL ANALYSIS VISIT - FXOpen Blog...

    Disclaimer: CFDs are complex instruments and come with a high risk of losing your money.

    Offline FXOpen Trader

    • Hero Member
    • *
    • Activity: 851
    • points:
      52859
    • Karma: 0
    • Trade Count: (0)
    • Referrals: 0
    • Last Active: April 11, 2024, 12:55:29 PM
      • View Profile

    • Total Badges: 11
      Badges: (View All)
      Second year Anniversary 500 Posts One year Anniversary
    Re: Daily Market Analysis By FXOpen
    « Reply #295 on: November 13, 2022, 01:32:50 PM »
    Watch FXOpen's November 7 - 11 Weekly Market Wrap Video

    In this video, FXOpen UK COO Gary Thomson sums up the week’s happenings and discusses the most significant news reports.

    • FTX crash overshadows inflation news
    • Bearish reversal in the oil market?
    • EUR/USD aiming at more upsides
    • Big tech stocks in focus

    Watch our short and informative video, and stay updated with FXOpen.


    FXOpen YouTube

    Disclaimer: CFDs are complex instruments and come with a high risk of losing your money.

    Offline FXOpen Trader

    • Hero Member
    • *
    • Activity: 851
    • points:
      52859
    • Karma: 0
    • Trade Count: (0)
    • Referrals: 0
    • Last Active: April 11, 2024, 12:55:29 PM
      • View Profile

    • Total Badges: 11
      Badges: (View All)
      Second year Anniversary 500 Posts One year Anniversary
    Re: Daily Market Analysis By FXOpen
    « Reply #296 on: November 14, 2022, 07:02:23 AM »
    GBP/USD Climbs Higher, EUR/GBP Eyes Upside Break


    GBP/USD started a recovery wave and climbed above the 1.1750 resistance. EUR/GBP is trading above the 0.8700 support and might eye a fresh increase.

    Important Takeaways for GBP/USD and EUR/GBP

    • The British Pound started a fresh increase after it broke the 1.1550 resistance against the US Dollar.
    • There is a key bullish trend line forming with support near 1.1780 on the hourly chart of GBP/USD.
    • EUR/GBP started a decent increase and remained well bid above the 0.8700 support.
    • There is a major bearish trend line forming with resistance near 0.8765 on the hourly chart.

    GBP/USD Technical Analysis

    The British Pound found support near the 1.1350 zone against the US Dollar. The GBP/USD pair started a recovery wave and was able to clear the 1.1550 resistance zone.

    There was a decent increase above the 1.1650 level and the 50 hourly simple moving average. The pair even climbed above the 1.1750 level. A high was formed near 1.1852 on FXOpen and the pair is now consolidating gains.

    GBP/USD Hourly Chart


    On the downside, an initial support is near the 1.1780 level. There is also a key bullish trend line forming with support near 1.1780 on the hourly chart of GBP/USD, below which it could test the 23.6% Fib retracement level of the upward move from the 1.1334 swing low to 1.1852 high.

    The next major support is near the 1.1650 level and the 50 hourly simple moving average. Any more losses could lead the pair towards the 1.1600 support zone or the 50% Fib retracement level of the upward move from the 1.1334 swing low to 1.1852 high.

    On the upside, an initial resistance is near the 1.1820 level. The next main resistance is near the 1.1850 zone. A clear upside break above the 1.1820 and 1.1850 resistance levels could open the doors for a steady increase in the near term. The next major resistance sits near the 1.2000 level.

    VIEW FULL ANALYSIS VISIT - FXOpen Blog...

    Disclaimer: CFDs are complex instruments and come with a high risk of losing your money.

    Offline FXOpen Trader

    • Hero Member
    • *
    • Activity: 851
    • points:
      52859
    • Karma: 0
    • Trade Count: (0)
    • Referrals: 0
    • Last Active: April 11, 2024, 12:55:29 PM
      • View Profile

    • Total Badges: 11
      Badges: (View All)
      Second year Anniversary 500 Posts One year Anniversary
    Re: Daily Market Analysis By FXOpen
    « Reply #297 on: November 16, 2022, 02:31:47 AM »
    BTCUSD and XRPUSD Technical Analysis – 15th NOV 2022


    BTCUSD: Double Bottom Pattern Above $15590

    Bitcoin was unable to sustain its bullish momentum and after touching a high of 20877 on 07th Nov, the prices started to decline against the US dollar touching a low of 15622 on 10th Nov.

    After this decline we can see some correction in the price of bitcoin which is now trading above the 16500 in the European Trading session today.

    We can see the formation of a bullish harami pattern in both the 30-minute and weekly time frames.

    The RSI indicator is back over 50 indicating the bullish scenario present in the markets.

    We can clearly see a double bottom pattern above the $15590 handle which is a bullish reversal pattern because it signifies the end of a downtrend and a shift towards an uptrend.

    Bitcoin touched an intraday low of 16364 in the Asian trading session and an intraday high of 16968 in the European trading session today.

    Both the STOCH and STOCHRSI are indicating overbought levels which means that in the immediate short term, a decline in the prices is expected.

    The relative strength index is at 58 indicating a STRONG demand for bitcoin, and the continuation of the buying pressure in the markets.

    Bitcoin is now moving above its 100 hourly exponential moving average and below its 200 hourly exponential moving averages.

    Most of the major technical indicators are giving a STRONG BUY signal, which means that in the immediate short term, we are expecting targets of 17000 and 18500.

    The average true range is indicating LESS market volatility with a mildly bullish momentum.

    • Bitcoin: bullish reversal seen above $15590
    • The Williams percent range is indicating an overbought level
    • The price is now trading just below its pivot level of $16924
    • Most of the moving averages are giving a BUY market signal

    Bitcoin: Bullish Reversal Seen Above $15590


    We can now see that the price of bitcoin is moving in a mildly bullish momentum and we are expecting more correction waves in this week.

    We can see the formation of a three white soldiers pattern in the 4-hour time frame.

    We can see a bullish trend reversal signal with adaptive moving average AMA50 in the 2-hourly time frame.

    The price of bitcoin is now moving in an up-channel formation above the $16000 handle.

    Some of the technical indicators are also giving a neutral stance of the markets.

    The immediate short-term outlook for bitcoin is strongly bullish,the medium-term outlook has turned bullish, and the long-term outlook remains neutral under present market conditions.

    Bitcoin’s support zone is located at $16447 which is a pivot point, and $16783 which is a 14-3 day raw stochastic at 20%.

    The price of BTCUSD is now facing its classic resistance level of 17015 and Fibonacci resistance level of 17090 after which the path towards 21500 will get cleared.

    In the last 24hrs, BTCUSD has increased by 0.36% by 59$ and has a 24hr trading volume of USD 41.390 billion. We can see an increase of 5.45% in the trading volume compared to yesterday, which appears to be normal.

    The Week Ahead

    The price of Bitcoin is moving in an ascending channel forming with support at $15850 on the hourly chart of the BTCUSD.

    Both the MACD and RSI are now giving bullish divergence signals on the weekly time frame.

    Now we are aiming for $17849 which is a 38.2% retracement from a 4-week low.

    The daily RSI is printing at 36 which indicates a weaker demand for bitcoin and a shift towards the consolidation/correction phase in the markets.

    The prices of BTCUSD will need to remain above the important support levels of $16000 this week.

    The weekly outlook is projected at $18500 with a consolidation zone of $18000.

    Technical Indicators:

    The moving averages convergence divergence, MACD (12,26): is at 90.80 indicating a BUY

    The commodity channel index, CCI (14): is at 72.52 indicating a BUY

    The rate of price change, ROC: is at 3.18 indicating a BUY

    The bull/bear power (13): is at 201.98 indicating a BUY

    VIEW FULL ANALYSIS VISIT - FXOpen Blog...

    Disclaimer: CFDs are complex instruments and come with a high risk of losing your money.

    Offline FXOpen Trader

    • Hero Member
    • *
    • Activity: 851
    • points:
      52859
    • Karma: 0
    • Trade Count: (0)
    • Referrals: 0
    • Last Active: April 11, 2024, 12:55:29 PM
      • View Profile

    • Total Badges: 11
      Badges: (View All)
      Second year Anniversary 500 Posts One year Anniversary
    Re: Daily Market Analysis By FXOpen
    « Reply #298 on: November 17, 2022, 03:18:40 PM »
    ETHUSD and LTCUSD Technical Analysis – 17th NOV, 2022


    ETHUSD: Bearish Engulfing Pattern Below $1349

    Ethereum was unable to sustain its bullish momentum and after touching a high of 1349 on 10th Nov, the prices started to decline against the US dollar touching a low of 1171 on 14th Nov.

    After this decline, we can see some upwards correction in the levels of Ethereum above the $1200 handle.

    We have seen a bearish opening of the markets this week.

    We can clearly see a bearish engulfing pattern below the $1349 handle which is a bearish pattern and signifies the end of a bullish phase and the start of a bearish phase in the markets.

    ETH is now trading just below its pivot levels of 1204 and moving into a mildly bearish channel. The price of ETHUSD is now testing its classic support level of 1188 and Fibonacci resistance level of 1198 after which the path towards 1100 will get cleared.

    The relative strength index is at 40 indicating a WEAK demand for Ether and the continuation of the selling pressure in the markets.

    The prices are ranging near the horizontal resistance in the weekly time frame, indicating a bearish trend.

    Both the STOCHRSI and Williams percent range are indicating oversold levels.

    All of the technical indicators are giving a STRONG SELL market signal.

    Most of the moving averages are giving a STRONG SELL signal and we are now looking at the levels of $1150 to $1100 in the short-term range.

    ETH is now trading below both the 100 & 200 hourly simple and exponential moving averages.

    • Ether: bearish reversal seen below the $1349 mark
    • Short-term range appears to be mildly bearish
    • ETH continues to remain below the $1300 level
    • The average true range is indicating LESS market volatility

    Ether: Bearish Reversal Seen Below $1349


    ETHUSD is now moving in a mildly bearish channel with the prices trading below the $1300 handle in the European trading session today.

    ETH continues to remain under pressure this month and fresh downsides are expected below the $1100 handle.

    ETHUSD touched an intraday high of 1227 and an intraday low of 1193 in the Asian trading session today.

    We can see a bullish price crossover pattern with moving averages MA50 and MA100 in the 1-hour time frame.

    We can also see the formation of a black evening star pattern in the 15-minute time frame.

    The daily RSI is printing at 38 indicating a very weak demand for Ether in the long-term range.

    The key support level to watch is $1186 which is the last resistance level, and $1195 which is a 14-3 day raw stochastic at 20%

    ETH has decreased by 3.15% with a price change of 38.81$ in the past 24hrs and has a trading volume of 11.524 billion USD.

    We can see an increase of 1.46% in the total trading volume in the last 24 hrs which appears to be normal.

    The Week Ahead

    ETH price continues to remain in a bearish zone against the US dollar and bitcoin. ETHUSD is expected to move lower towards the $1100 and $11150 levels this week.

    We can see the formation of a major bearish trend line in place from $1349 towards $1119 levels.

    The immediate short-term outlook for Ether has turned mildly bearish, the medium-term outlook has turned neutral, and the long-term outlook for Ether is neutral in present market conditions.

    The prices of ETHUSD will need to remain above the important support levels of $1094 which is the 3rd support pivot point.

    The weekly outlook is projected at $1150 with a consolidation zone of $1100.

    Technical Indicators:

    The relative strength index (14): is at 37.20 indicating a SELL

    The rate of price change: is at -1.23 indicating a SELL

    Bull/Bear power (13): is at -14.17 indicating a SELL

    High/lows (14): is at -7.94 indicating a SELL

    VIEW FULL ANALYSIS VISIT - FXOpen Blog...

    Disclaimer: CFDs are complex instruments and come with a high risk of losing your money.

    Offline FXOpen Trader

    • Hero Member
    • *
    • Activity: 851
    • points:
      52859
    • Karma: 0
    • Trade Count: (0)
    • Referrals: 0
    • Last Active: April 11, 2024, 12:55:29 PM
      • View Profile

    • Total Badges: 11
      Badges: (View All)
      Second year Anniversary 500 Posts One year Anniversary
    Re: Daily Market Analysis By FXOpen
    « Reply #299 on: November 20, 2022, 04:19:05 AM »
    Watch FXOpen's November 14 - 18 Weekly Market Wrap Video

    In this video, FXOpen UK COO Gary Thomson sums up the week’s happenings and discusses the most significant news reports.

    • How will Rishi Sunak affect the pound?
    • US may avoid recession whereas Europe may plunge deeper
    • EUR/USD rallies while USD/JPY takes a major hit
    • GBPUSD reaches 1.20, what's next?
    • Inflation in the UK hits high at 11.1% as US inflation goes down.

    Watch our short and informative video, and stay updated with FXOpen.


    FXOpen YouTube

    Disclaimer: CFDs are complex instruments and come with a high risk of losing your money.


    ETH & ERC20 Tokens Donations: 0x2143F7146F0AadC0F9d85ea98F23273Da0e002Ab
    BNB & BEP20 Tokens Donations: 0xcbDAB774B5659cB905d4db5487F9e2057b96147F
    BTC Donations: bc1qjf99wr3dz9jn9fr43q28x0r50zeyxewcq8swng
    BTC Tips for Moderators: 1Pz1S3d4Aiq7QE4m3MmuoUPEvKaAYbZRoG
    Powered by SMFPacks Social Login Mod