follow us on twitter . like us on facebook . follow us on instagram . subscribe to our youtube channel . announcements on telegram channel . ask urgent question ONLY . Subscribe to our reddit . Altcoins Talks Shop Shop


This is an Ad. Advertised sites are not endorsement by our Forum. They may be unsafe, untrustworthy, or illegal in your jurisdiction. Advertise Here Ads bidding Bidding Open

Author Topic: Daily Market Analysis By FXOpen  (Read 46906 times)

Offline FXOpen Trader

  • Hero Member
  • *
  • Activity: 851
  • points:
    52859
  • Karma: 0
  • Trade Count: (0)
  • Referrals: 0
  • Last Active: April 11, 2024, 12:55:29 PM
    • View Profile

  • Total Badges: 11
    Badges: (View All)
    Second year Anniversary 500 Posts One year Anniversary
Re: Daily Market Analysis By FXOpen
« Reply #315 on: December 15, 2022, 02:54:03 PM »
ETHUSD and LTCUSD Technical Analysis – 15th DEC, 2022


ETHUSD: Three White Soldiers Pattern Above $1222

Ethereum was unable to sustain its bearish momentum and after touching a low of 1222 on 08th Dec, the price started to correct upwards against the US dollar moving into a consolidation channel above the $1250 handle today in the European trading session.

We can see the formation of a bullish doji star pattern in the 1-hour time frame indicating bullish trends.

The commodity channel index indicator is giving a bullish divergence signal in the 1-hour time frame.

We can clearly see a three white soldiers pattern above the $1222 handle which is a bullish pattern and signifies the end of a bearish phase and the start of a bullish phase in the markets.

ETH is now trading just above its pivot level of 1286 and is moving into a consolidation channel. The price of ETHUSD is now testing its classic resistance level of 1287 and Fibonacci resistance level of 1288 after which the path towards 1300 will get cleared.

The relative strength index is at 48 indicating a NEUTRAL demand for Ether and the continuation of the consolidation phase in the markets.

The resistance of the channel is broken on the daily time frame.

The STOCHRSI is indicating an OVERBOUGHT level, which means that the prices are expected to decline in the short-term range.

Some of the technical indicators are giving a BUY market signal.

Most of the moving averages are giving a NEUTRAL signal due to the market consolidation seen below the $1300 handle.

ETH is now trading below both the 100 hourly simple and 200 hourly exponential moving averages.

  • Ether: bullish reversal seen above the $1222 mark
  • The short-term range appears to be mildly bullish
  • ETH continues to remain above the $1250 level
  • The average true range is indicating LESS market volatility

Ether: Bullish Reversal Seen Above $1222


ETHUSD is now moving into a consolidation/correction channel with the price trading below the $1300 handle in the European trading session today.

The prices of Ethereum are ranging near the support of the channel indicating bullish trends.

The MACD indicator is now giving a bullish divergence signal in the 30-minute time frame.

The price of Ethereum broke the $1300 level and then we can see some decline due to short selling of Ether which caused the dip below the $1300 level.

ETHUSD touched an intraday high of 1314 and an intraday low of 1281 in the Asian trading session today.

We have seen a bullish opening in the markets this week.

The daily RSI is printing at 51 indicating a neutral demand for Ether in the long-term range.

The key support levels to watch are $1210 which is a 14-3 day raw stochastic at 30%, and $1244 which is a 38.2% retracement from 4 Week High.

ETH has decreased by 2.50% with a price change of 33.04$ in the past 24hrs and has a trading volume of 8.409 billion USD.

We can see an increase of 0.58% in the total trading volume in the last 24 hrs which appears to be normal.

The Week Ahead

The price of ETH has now entered into a consolidation/correction zone, and after this we are expecting fresh upside waves crossing the $1300 and $1400 levels.

ETHUSD continues to gain bullish traction from a weekly time frame from a 4-hour time frame with the bottom support located at $1075 touched on 22nd Nov.

The immediate short-term outlook for Ether has turned mildly bullish, the medium-term outlook has turned neutral, and the long-term outlook for Ether is neutral in present market conditions.

The price of ETHUSD will need to remain above the important support level of $1243 at which the price crosses the 18-day moving average.

The resistance zone is located at $1291 at which the price crosses 9-day moving average stalls.

The weekly outlook is projected at $1350 with a consolidation zone of $1300.

Technical Indicators:

The Williams percent range: is at -24.78 indicating a BUY

The commodity channel index (14): is at 62.01 indicating a BUY

High/Lows (14): is at 0.3436 indicating a BUY

Bull/Bear power (13): is at 0.6240 indicating a BUY

VIEW FULL ANALYSIS VISIT - FXOpen Blog...

Disclaimer: This forecast represents FXOpen Companies opinion only, it should not be construed as an offer, invitation or recommendation in respect to FXOpen Companies products and services or as financial advice.

Altcoins Talks - Cryptocurrency Forum

Re: Daily Market Analysis By FXOpen
« Reply #315 on: December 15, 2022, 02:54:03 PM »

This is an Ad. Advertised sites are not endorsement by our Forum. They may be unsafe, untrustworthy, or illegal in your jurisdiction. Advertise Here Ads bidding Bidding Open


Offline FXOpen Trader

  • Hero Member
  • *
  • Activity: 851
  • points:
    52859
  • Karma: 0
  • Trade Count: (0)
  • Referrals: 0
  • Last Active: April 11, 2024, 12:55:29 PM
    • View Profile

  • Total Badges: 11
    Badges: (View All)
    Second year Anniversary 500 Posts One year Anniversary
Re: Daily Market Analysis By FXOpen
« Reply #316 on: December 18, 2022, 08:16:52 AM »
Watch FXOpen's December 12 - 16 Weekly Market Wrap Video

In this video, FXOpen UK COO Gary Thomson sums up the week’s happenings and discusses the most significant news reports.

  • Sudden gold price hike attracts speculative attention
  • What the future holds for the Fed
  • EUR/USD gains bullish momentum while USD/CHF dips further
  • GBP makes remarkable gains as UK inflation slows, but it's still 10.7%

Watch our short and informative video and stay updated with FXOpen.


FXOpen YouTube


Disclaimer: This forecast represents FXOpen Companies opinion only, it should not be construed as an offer, invitation or recommendation in respect to FXOpen Companies products and services or as financial advice.

Offline FXOpen Trader

  • Hero Member
  • *
  • Activity: 851
  • points:
    52859
  • Karma: 0
  • Trade Count: (0)
  • Referrals: 0
  • Last Active: April 11, 2024, 12:55:29 PM
    • View Profile

  • Total Badges: 11
    Badges: (View All)
    Second year Anniversary 500 Posts One year Anniversary
Re: Daily Market Analysis By FXOpen
« Reply #317 on: December 20, 2022, 02:56:35 AM »
FTSE 100 begins slow recovery from 1 month low


The FTSE 100 index , which is the index containing the 100 most prestigious companies on the London stock exchange plummeted to a one month low on Friday.

There has been some degree of volatility in that particular index during the course of the last 30 days, but overall it has been quite steady and fans back each day.

On Friday, December 16 however, it’s suddenly plunged to 7306, representing its lowest point by far in over 30 days.

Just three days earlier the FTSC 100 index was standing at a very healthy 7526 so to plunge more than 200 points in three days is quite a downward spiral.

Perhaps some of the reason, for it is actually short term rather than anything to do with an overall lingering knowledge that the UK economy is generally struggling and has been for some time.

In fact, some analysts are noting that this is more to do with strikes in the public sector which are taking place during the course of this week having started on Friday last week, which coincides with the sudden plunge of the FTSE 100 index, and that these public sector strikes which affect the logistics and civil service could impede the operations of large corporations.

This would make sense, because of course, everybody is already accustomed to the difficulty economic circumstances which surround the overall UK economy there for such circumstances, would not be likely to have caused the sudden downturn in share performance.

It is, therefore, perhaps, worth looking out for how the FTSE 100 index performs after the strikes have finished and a possible settlement with workers unions may well be reached.

VIEW FULL ANALYSIS VISIT - FXOpen Blog...

Disclaimer: This forecast represents FXOpen Companies opinion only, it should not be construed as an offer, invitation or recommendation in respect to FXOpen Companies products and services or as financial advice.

Offline FXOpen Trader

  • Hero Member
  • *
  • Activity: 851
  • points:
    52859
  • Karma: 0
  • Trade Count: (0)
  • Referrals: 0
  • Last Active: April 11, 2024, 12:55:29 PM
    • View Profile

  • Total Badges: 11
    Badges: (View All)
    Second year Anniversary 500 Posts One year Anniversary
Re: Daily Market Analysis By FXOpen
« Reply #318 on: December 21, 2022, 02:25:55 AM »
BTCUSD and XRPUSD Technical Analysis – 20th DEC 2022


BTCUSD: Bullish Harami Pattern Above $16325

Bitcoin was unable to sustain its bullish momentum and after touching a high of $18360 on 14th Dec, the price started to decline against the US dollar coming down below the $16500 handle in the early Asian trading session today.

The price of bitcoin has since bounced back from its lows touching $16800 levels in the European Trading session today.

We have seen a bullish opening of the markets this week.

We can clearly see a bullish harami pattern above the $16325 handle which is a bullish reversal pattern because it signifies the end of a downtrend and a shift towards an uptrend.

Bitcoin touched an intraday low of 16322 in the Asian trading session and an intraday high of 16846 in the European trading session today.

We can see the formation of the bullish trend reversal pattern with the adaptive moving average AMA20 and MA20 in the 4-hour time frame.

Both the RSI and STOCHRSI are indicating overbought levels which means that in the immediate short term, a decline in the prices is expected.

The relative strength index is at 75 indicating an OVERBOUGHT level for bitcoin, and the possibility of an immediate correction in the price towards the $16500 levels.

Bitcoin is now moving above its 100 hourly simple moving average and below its 200 hourly exponential moving average.

All of the major technical Indicators are giving a STRONG BUY signal, which means that in the immediate short term, we are expecting targets of 17000 and 18500.

The average true range is indicating high market volatility with a strong bullish momentum.

  • Bitcoin: bullish reversal seen above $16325
  • The Williams percent range is indicating an overbought level
  • The price is now trading just below its pivot level of $16822
  • The short-term range is mildly bullish

Bitcoin: Bullish Reversal Seen Above $16325


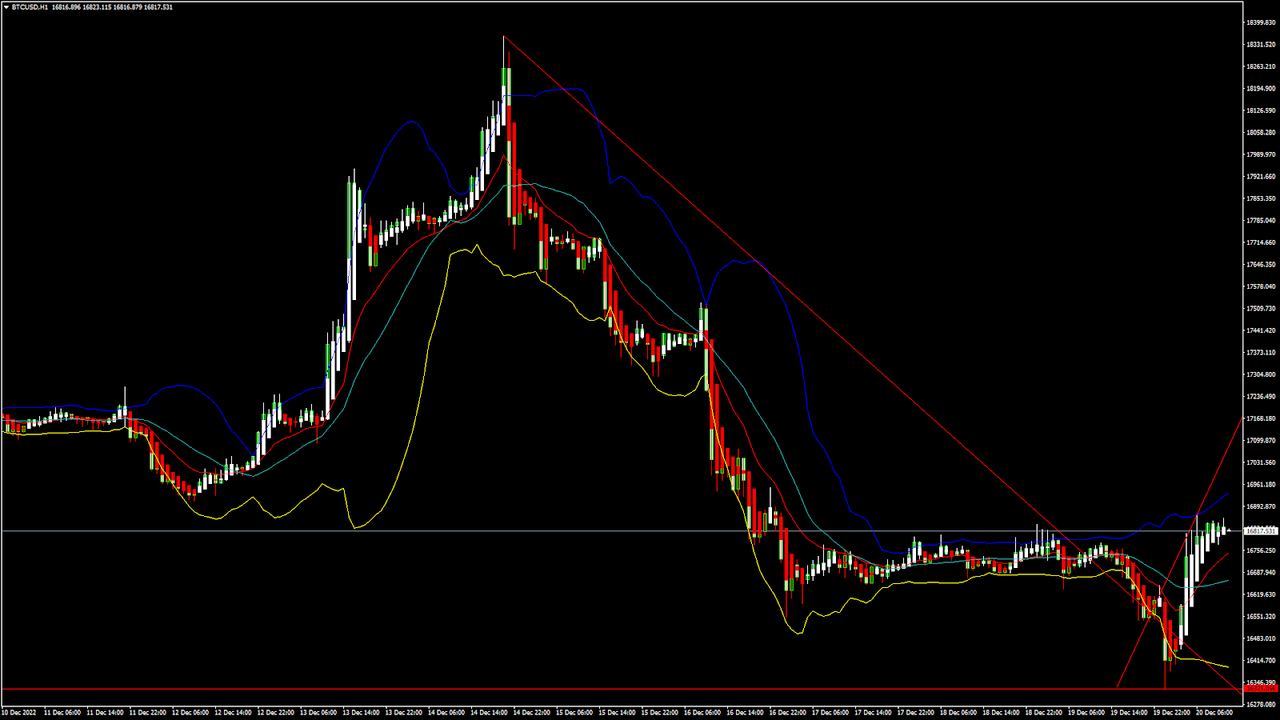
We can now see that the price of bitcoin is moving in a mildly bullish momentum, and we are expecting moves towards the $17000 levels before any market consolidation this week.

Some of the technical indicators are also giving a neutral tone of the markets.

We are now waiting for the next upwards leg above the $17500 handle which will push the prices towards the $18000 level.

The price of bitcoin is expected to enter into a super bullish zone after crossing the $18000 level.

The immediate short-term outlook for bitcoin is strongly bullish, the medium-term outlook has turned bullish, and the long-term outlook remains neutral under present market conditions.

Bitcoin’s support zone is located at $16329 which is a 3-10 day MACD oscillator stalls.

The price of BTCUSD is now facing its classic resistance level of 16862 and Fibonacci resistance level of 16885 after which the path towards 17500 will get cleared.

In the last 24hrs, BTCUSD has increased by 0.28% by 47.59$ and has a 24hr trading volume of USD 21.646 billion. We can see an increase of 72.88% in the trading volume compared to yesterday, which is due to heavy buying action seen at lower levels.

The Week Ahead

Bitcoin’s price is gaining pace above the $16000 handle and might soon break the $17000 level for more gains above $18000.

The price of Bitcoin has failed to clear the resistance at $18360 and we are now again testing the $18000 level soon.

The start of the festive season with Christmas and New Year holidays might dampen the interest of the global investors, and we will have to wait for the New Year 2023.

The daily RSI is printing at 46 which indicates a NEUTRAL demand for bitcoin and the possibility of a shift towards the consolidation/correction phase for a short term in the markets.

The price of BTCUSD is now facing its resistance zone at $17789 which is a 38.2% retracement from a 13 week low.

The weekly outlook is projected at $18000 with a consolidation zone of $17500.

Technical Indicators:

The average directional index, ADX (14): is at 36.24 indicating a BUY

The ultimate oscillator: is at 58.98 indicating a BUY

The rate of price change, ROC: is at 1.246 indicating a BUY

Bull/bear power (13): is at 144.44 indicating a BUY

VIEW FULL ANALYSIS VISIT - FXOpen Blog...

Disclaimer: This forecast represents FXOpen Companies opinion only, it should not be construed as an offer, invitation or recommendation in respect to FXOpen Companies products and services or as financial advice.

Offline FXOpen Trader

  • Hero Member
  • *
  • Activity: 851
  • points:
    52859
  • Karma: 0
  • Trade Count: (0)
  • Referrals: 0
  • Last Active: April 11, 2024, 12:55:29 PM
    • View Profile

  • Total Badges: 11
    Badges: (View All)
    Second year Anniversary 500 Posts One year Anniversary
Re: Daily Market Analysis By FXOpen
« Reply #319 on: December 22, 2022, 03:53:35 PM »
ETHUSD and LTCUSD Technical Analysis – 22nd DEC, 2022


ETHUSD: Bullish Harami Pattern Above $1152

Ethereum was unable to sustain its bearish momentum and after touching a low of 1152 on 20th Dec, the price started to correct upwards against the US dollar crossing the $1200 handle today in the European trading session.

We have seen a bullish opening of the markets this week.

We can clearly see a bullish harami pattern above the $1152 handle which is a bullish pattern and signifies the end of a bearish phase and the start of a bullish phase in the markets.

ETH is now trading just above its pivot level of 1217 and moving into a mildly bullish channel. The price of ETHUSD is now testing its classic resistance level of 1221 and Fibonacci resistance level of 1224 after which the path towards 1300 will get cleared.

The relative strength index is at 59 indicating a strong demand for Ether and the continuation of the bullish phase in the markets.

We can see the formation of bullish engulfing lines in the 4-hour time frame.

Both the STOCHRSI and Williams percent range are indicating an overbought market, which means that the prices are expected to decline in the short-term range.

Most of the technical indicators are giving a BUY market signal.

Most of the moving averages are giving a BUY signal and we are now looking at the levels of $1350 to $1400 in the short-term range.

ETH is now trading above its 100 & 200 hourly simple and exponential moving averages.

  • Ether: bullish reversal seen above the $1152 mark
  • Short-term range appears to be mildly bullish
  • ETH continues to remain above the $1200 level
  • The average true range is indicating LESS market volatility

Ether: Bullish Reversal Seen Above $1152


ETHUSD is now moving into a mildly bullish channel with the price trading above the $1200 handle in the European trading session today.

ETH touched an intraday low of 1209 in the Asian trading session and an intraday high of 1220 in the European trading session today.

We can see that the price is back over the pivot point in the 4-hour time frame.

The parabolic SAR indicator is giving a bullish reversal signal in the 2-hour time frame.

The Ichimoku price is over the cloud in the 2-hour time frame indicating a bullish tone of the markets.

The price of Ethereum is marching towards a bullish zone against the US dollar and bitcoin. ETH/USD could continue to move higher back towards the $1400 level.

The daily RSI is printing at 47 indicating a NEUTRAL demand for Ether in the medium-term range.

The key support levels to watch are $1184 which is a 3-10 day MACD oscillator stalls, and $1191 which is a 14-3 day raw stochastic at 20%.

ETH has increased by 0.20% with a price change of 2.43$ in the past 24hrs and has a trading volume of 37.617 billion USD.

We can see a decrease of 29.77% in the total trading volume in the last 24 hrs which appears to be normal.

The Week Ahead

ETH’s price continues to remain in a bullish zone against the US dollar and bitcoin. ETHUSD is expected to move higher towards the $1300 and $1400 levels this week.

On the upside we are now looking at the immediate targets of 1303 which is a 38.2% retracement from a 13-week low, and 1372 which is a 50% retracement from 13-week high/low.

The immediate short-term outlook for Ether has turned mildly bullish, the medium-term outlook has turned neutral, and the long-term outlook for Ether is neutral in present market conditions.

The price of ETHUSD will need to remain above the important support level of $1172 at which the price crosses 18-day moving average stalls.

The weekly outlook is projected at $1450 with a consolidation zone of $1350.

Technical Indicators:

The average directional index, ADX (14): is at 33.73 indicating a BUY

The rate of price change: is at 0.694 indicating a BUY

Bull/bear power (13): is at 9.48 indicating a BUY

High/lows (14): is at 2.49 indicating a BUY

VIEW FULL ANALYSIS VISIT - FXOpen Blog...

Disclaimer: This forecast represents FXOpen Companies opinion only, it should not be construed as an offer, invitation or recommendation in respect to FXOpen Companies products and services or as financial advice.

Offline FXOpen Trader

  • Hero Member
  • *
  • Activity: 851
  • points:
    52859
  • Karma: 0
  • Trade Count: (0)
  • Referrals: 0
  • Last Active: April 11, 2024, 12:55:29 PM
    • View Profile

  • Total Badges: 11
    Badges: (View All)
    Second year Anniversary 500 Posts One year Anniversary
Re: Daily Market Analysis By FXOpen
« Reply #320 on: December 24, 2022, 03:25:55 AM »
FXOpen 2022 Market Year Wrap With Gary Thomson

The turbulent trading year of 2022 is soon coming to an end, therefore FXOpen UK COO Gary Thomson has taken the chance to reflect on the major market events of the year. Watch now!

  • Meta Platforms’ stock price dived in February
  • Russia Invaded Ukraine
  • USD/JPY Bullish Breakout
  • Federal Reserve Delivers the Biggest Rate Hike Since 2000
  • The UK Mini-Budget Sent the Pound Lower in September
  • EUR/USD Dropped Below Parity
  • US Midterm Elections Were a Concern
  • US Stocks Bottomed in October But Remain Negative on the Year
  • US Tech Sector Announced Major Layoffs in November

Watch our short and informative video and stay updated with FXOpen.


FXOpen YouTube


Disclaimer: This forecast represents FXOpen Companies opinion only, it should not be construed as an offer, invitation or recommendation in respect to FXOpen Companies products and services or as financial advice.


Offline FXOpen Trader

  • Hero Member
  • *
  • Activity: 851
  • points:
    52859
  • Karma: 0
  • Trade Count: (0)
  • Referrals: 0
  • Last Active: April 11, 2024, 12:55:29 PM
    • View Profile

  • Total Badges: 11
    Badges: (View All)
    Second year Anniversary 500 Posts One year Anniversary
Re: Daily Market Analysis By FXOpen
« Reply #321 on: December 28, 2022, 05:20:21 AM »
BTCUSD and XRPUSD Technical Analysis – 27th DEC 2022


BTCUSD: Three White Soldiers Pattern Above $16323

Bitcoin was unable to sustain its bearish momentum and after touching a low of $16387 on 20th Dec, the prices started to correct upwards against the US dollar and are now ranging above the $16500 handle in the European trading session.

We have seen a bullish opening of the markets this week.

We can clearly see a three white soldiers pattern above the $16323 handle which is a bullish reversal pattern because it signifies the end of a downtrend and a shift towards an uptrend.

Bitcoin touched an intraday low of 16826 and an intraday high of 16970 in the Asian trading session today.

The prices are ranging near the support of the channel in the 1-hour time frame indicating a bullish tone of the markets.

Both the STOCH and Williams percent range are indicating overbought levels which means that in the immediate short term a decline in the prices is expected.

The relative strength index is at 51 indicating a NEUTRAL level for bitcoin, and the shift towards the consolidation phase in the markets.

Bitcoin is now moving above its 100 hourly simple moving average and below its 100 hourly exponential moving average.

Some of the major technical indicators are giving a BUY signal, which means that in the immediate short term, we are expecting targets of 17000 and 18000.

The average true range is indicating LESS market volatility with a mildly bullish momentum.

  • Bitcoin: bullish reversal seen above $16323
  • The STOCHRSI is indicating an oversold level
  • The price is now trading just below its pivot level of $16881
  • The short term range is mildly bullish

Bitcoin: Bullish Reversal Seen Above $16323


We can now see that the price of bitcoin is moving in a mildly bullish momentum and we are expecting moves towards the $17000 level before any market consolidation this week.

Some of the technical indicators are also giving a neutral tone of the markets.

We are now waiting for the next upwards leg above the $17000 handle which will push the price towards the $18000 levels.

We can see the formation of the bullish trend reversal pattern with adaptive moving averages AMA20 and AMA50 in the 30-minute time frame.

The price of bitcoin is ranging near the support of the triangle in the 1-hour time frame indicating a bullish trend.

The immediate short-term outlook for bitcoin is mildly bullish, the medium-term outlook has turned neutral, and the long-term outlook remains neutral under present market conditions.

Bitcoin’s support zone is located at $16374 which is a 3-10 day MACD oscillator stalls.

The price of BTCUSD is now facing its classic resistance level of 16902 and Fibonacci resistance level of 16912 after which the path towards 17000 will get cleared.

In the last 24hrs, BTCUSD has increased by 0.08% by 14.24$ and has a 24hr trading volume of USD 12.985 billion. We can see an increase of 3.96% in the trading volume compared to yesterday, which appears to be normal.

The Week Ahead

Bitcoin’s price is expected to remain in a consolidation phase before any major moves upwards due to the start of the holiday season, and trading volumes remain thin across the major cryptocurrency exchanges.

We are now looking for an upwards rally in the markets in 2023 with major targets at $20000 and $25000 levels.

The daily RSI is printing at 47 which indicates a NEUTRAL demand for bitcoin and the possibility of a shift towards the consolidation/correction phase for a short term in the markets.

The price of BTCUSD is now facing its resistance zone at $17175 which is a 50% retracement from a 4-week high/low and at $17765 at which the price crosses the 9-day moving average stalls.

The weekly outlook is projected at $17500 with a consolidation zone of $17000.

Technical Indicators:

The MACD (12,26): is at 6.40 indicating a BUY

The commodity channel index, CCI (14): is at -29.45 indicating a NEUTRAL

The rate of price change, ROC: is at 0.077 indicating a BUY

Bull/bear power (13): is at 2.02 indicating a BUY

VIEW FULL ANALYSIS VISIT - FXOpen Blog...

Disclaimer: This forecast represents FXOpen Companies opinion only, it should not be construed as an offer, invitation or recommendation in respect to FXOpen Companies products and services or as financial advice.

Altcoins Talks - Cryptocurrency Forum

Re: Daily Market Analysis By FXOpen
« Reply #321 on: December 28, 2022, 05:20:21 AM »


Offline FXOpen Trader

  • Hero Member
  • *
  • Activity: 851
  • points:
    52859
  • Karma: 0
  • Trade Count: (0)
  • Referrals: 0
  • Last Active: April 11, 2024, 12:55:29 PM
    • View Profile

  • Total Badges: 11
    Badges: (View All)
    Second year Anniversary 500 Posts One year Anniversary
Re: Daily Market Analysis By FXOpen
« Reply #322 on: December 28, 2022, 01:56:03 PM »
A Look Back Over 2022


The trading year ends in a couple of weeks from now, and everyone is planning for the holiday season. December, traditionally, is a short month for traders as markets slow down in the second half of the month.

As such, it is the best time to review what happened throughout the year, what moved financial markets, and what might happen in the period ahead.

VIEW FULL ANALYSIS VISIT - FXOpen Blog...

Disclaimer: This forecast represents FXOpen Companies opinion only, it should not be construed as an offer, invitation or recommendation in respect to FXOpen Companies products and services or as financial advice.

Offline FXOpen Trader

  • Hero Member
  • *
  • Activity: 851
  • points:
    52859
  • Karma: 0
  • Trade Count: (0)
  • Referrals: 0
  • Last Active: April 11, 2024, 12:55:29 PM
    • View Profile

  • Total Badges: 11
    Badges: (View All)
    Second year Anniversary 500 Posts One year Anniversary
Re: Daily Market Analysis By FXOpen
« Reply #323 on: December 29, 2022, 03:55:59 PM »
ETHUSD and LTCUSD Technical Analysis – 29th DEC, 2022


ETHUSD: Double Bottom Pattern Above $1183

Ethereum was unable to sustain its bearish momentum and after touching a low of 1185 on 22nd Dec, the price started to correct upwards against the US dollar moving into a consolidation channel above the $1200 handle on 27th Dec.

The prices are ranging near the support of the channel in the 15-minute time frame indicating a bullish trend.

We can clearly see a double bottom pattern above the $1183 handle which is a bullish pattern and signifies the end of a bearish phase and the start of a bullish phase in the markets.

ETH is now trading just above its pivot level of 1197 and moving into a consolidation channel. The price of ETHUSD is now testing its classic resistance level of 1202 and Fibonacci resistance level of 1206 after which the path towards 1300 will get cleared.

The relative strength index is at 53 indicating a NEUTRAL demand for Ether and the continuation of the consolidation phase in the markets.

Both the STOCHRSI and Williams percent range are indicating an OVERBOUGHT level, which means that the price is expected to decline in the short-term range.

Some of the technical indicators are giving a BUY market signal.

Most of the moving averages are giving a NEUTRAL signal due to the market consolidation seen below the $1250 handle.

ETH is now trading below its 100 hourly simple and 200 hourly exponential moving averages.

  • Ether: bullish reversal seen above the $1183 mark
  • The short-term range appears to be mildly bullish
  • ETH continues to remain above the $1150 level
  • The average true range is indicating LESS market volatility

Ether: Bullish Reversal Seen Above $1183


ETHUSD is now moving into a consolidation/correction channel with the price trading above the $1150 handle in the European trading session today.

We can see a range-bound movement in Ethereum from the last 15 days due to low liquidity and lower trading volumes.

The price of Ethereum has failed to clear the resistance of $1300 after touching a low of $1159 on 17th Dec.

ETHUSD touched an intraday low of 1184 in the Asian trading session and an intraday high of 1200 in the European trading session today.

We have seen a bullish opening in the markets this week.

The daily RSI is printing at 44 indicating a weak demand for Ether in the long-term range.

The key support levels to watch are $1152 which is a 1-month low, and $1183 which is a 3-10 day MACD oscillator stalls.

ETH has increased by 0.04% with a price change of 0.442$ in the past 24hrs and has a trading volume of 4.723 billion USD.

We can see an increase of 4.27% in the total trading volume in the last 24 hrs which appears to be normal.

The Week Ahead

ETH’s price started a minor correction above the $1200 handle and is now facing hurdles crossing the $1250 range on the upside.

The immediate short-term outlook for Ether has turned mildly bullish, the medium-term outlook has turned neutral, and the long-term outlook for Ether is neutral in present market conditions.

The price of ETHUSD will need to remain above the important support level of $1197 which is the pivot point.

The resistance zone is located at $1227 which is a 38.2% retracement from a 4-week low and at $1265 at which the price crosses 9-day moving average stalls.

The weekly outlook is projected at $1250 with a consolidation zone of $1200.

Technical Indicators:

The STOCH (9,6): is at 66.34 indicating a BUY

The commodity channel index (14): is at 162.66 indicating a BUY

High/lows (14): is at 4.04 indicating a BUY

Bull/bear power (13): is at 7.87 indicating a BUY

VIEW FULL ANALYSIS VISIT - FXOpen Blog...

Disclaimer: This forecast represents FXOpen Companies opinion only, it should not be construed as an offer, invitation or recommendation in respect to FXOpen Companies products and services or as financial advice.

Offline FXOpen Trader

  • Hero Member
  • *
  • Activity: 851
  • points:
    52859
  • Karma: 0
  • Trade Count: (0)
  • Referrals: 0
  • Last Active: April 11, 2024, 12:55:29 PM
    • View Profile

  • Total Badges: 11
    Badges: (View All)
    Second year Anniversary 500 Posts One year Anniversary
Re: Daily Market Analysis By FXOpen
« Reply #324 on: January 03, 2023, 12:20:20 PM »
    BTCUSD and XRPUSD Technical Analysis – 03rd JAN 2023


    BTCUSD: Bullish Engulfing Pattern Above $16372

    Bitcoin was unable to sustain its bearish momentum and after touching a low of $16372 on 30th Dec, the prices started to correct upwards against the US dollar and are now ranging above the $16600 handle in the European trading session today.

    The price of bitcoin is ranging near the support of the channel in the weekly time frame indicating a bullish trend.

    We can clearly see a bullish engulfing pattern above the $16372 handle which is a bullish reversal pattern because it signifies the end of a downtrend and a shift towards an uptrend.

    Bitcoin touched an intraday low of 16655 and an intraday high of 16781 in the Asian trading session today.

    The price is forming an ascending channel with the current support of $16690 at which the price crosses the 9-day moving average.

    Both the STOCH and Williams percent range are indicating overbought levels which means that in the immediate short term, a decline in the prices is expected.

    The relative strength index is at 58.47 indicating a STRONG demand for bitcoin, and the continuation of the buying pressure in the markets.

    Bitcoin is now moving above its 100 hourly simple moving average and above its 100 hourly exponential moving averages.

    Some of the major technical Indicators are giving a BUY signal, which means that in the immediate short term, we are expecting targets of 17500 and 18500.

    The average true range is indicating HIGH market volatility with a mild bullish momentum.

    [LIST=1]
    • Bitcoin: bullish reversal seen above $16372
    • The average directional index is indicating a NEUTRAL level
    • The price is now trading just below its pivot level of $16752
    • The short term range is mildly bullish

    Bitcoin: Bullish Reversal Seen Above $16372


    We can now see that the price of bitcoin is moving in the correction phase after the recent decline below the $16500 level. The immediate targets are $17500 and $18500 in the short-term range.

    Once the price of bitcoin will touch $18000, we are expecting a rally into the markets towards the $20000 level.

    We can see the formation of the bullish trend reversal pattern with the adaptive moving average AMA50 and AMA100 in the 1-hour time frame.

    Any dips from the current levels remain well supported above the $16500 handle as the bitcoin price continues to gain traction against the US dollar.

    The immediate short-term outlook for bitcoin is mildly bullish, the medium-term outlook has turned neutral, and the long-term outlook remains neutral under present market conditions.

    Bitcoin’s support zone is located at $16662 which is a pivot point, and at $16723 which is a 3-10 day MACD oscillator stalls.

    The price of BTCUSD is now facing its classic resistance level of 16765 and Fibonacci resistance level of 16773 after which the path towards 17000 will get cleared.

    In the last 24hrs, BTCUSD has increased by 0.08% by 13.10$ and has a 24hr trading volume of USD 11.564 billion. We can see an increase of 5.89% in the trading volume compared to yesterday, which appears to be normal.

    The Week Ahead

    Bitcoin’s price is expected to enter into a consolidation phase below the $17000 level. As the market liquidity increases, we will see the price upticking towards the $18000 handle.

    As of now, the moves are expected to be in a narrow range between the $16000 and $17500 levels.

    The daily RSI is printing at 47 which indicates a NEUTRAL demand for bitcoin and the possibility of a shift towards the consolidation/correction phase for a short term in the markets.

    The price of BTCUSD is now facing its resistance zone at $17096 which is a 38.2% retracement from a 4-week low, and at $17333 which is a 14-3 day raw stochastic at 50%.

    The weekly outlook is projected at $17500 with a consolidation zone of $17000.

    Technical Indicators:

    The MACD (12,26): is at 20.50 indicating a BUY

    The commodity channel index, CCI (14): is at 73.18 indicating a BUY

    The rate of price change, ROC: is at 0.048 indicating a BUY

    The Bull/bear power (13): is at 31.92 indicating a BUY

    VIEW FULL ANALYSIS VISIT - FXOpen Blog...

    Disclaimer: This forecast represents FXOpen Companies opinion only, it should not be construed as an offer, invitation or recommendation in respect to FXOpen Companies products and services or as financial advice.

    Offline FXOpen Trader

    • Hero Member
    • *
    • Activity: 851
    • points:
      52859
    • Karma: 0
    • Trade Count: (0)
    • Referrals: 0
    • Last Active: April 11, 2024, 12:55:29 PM
      • View Profile

    • Total Badges: 11
      Badges: (View All)
      Second year Anniversary 500 Posts One year Anniversary
    Re: Daily Market Analysis By FXOpen
    « Reply #325 on: January 05, 2023, 04:34:16 PM »
    ETHUSD and LTCUSD Technical Analysis – 05th JAN, 2023


    ETHUSD: Bullish Engulfing Pattern Above $1181

    Ethereum was unable to sustain its bearish momentum and after touching a low of 1181 on 30th Dec, the price started to correct upwards against the US dollar moving into a consolidation channel above the $1200 handle today in the European trading session.

    We can see the formation of bullish engulfing lines in the weekly time frame.

    We can clearly see a bullish engulfing pattern above the $1181 handle which is a bullish pattern and signifies the end of a bearish phase and the start of a bullish phase in the markets.

    ETH is now trading just below its pivot level of 1251 and moving into a consolidation channel. The price of ETHUSD is now testing its classic resistance level of 1254 and Fibonacci resistance level of 1257 after which the path towards 1300 will get cleared.

    The relative strength index is at 69.10 indicating a STRONG demand for Ether and the continuation of the buying pressure in the markets.

    The average directional index is indicating a NEUTRAL level, which means that the price is expected to remain under consolidation in the short-term range.

    Most of the technical indicators are giving a BUY market signal.

    Most of the moving averages are giving a BUY signal at the current market levels of $1250.

    ETH is now trading Above its 100 hourly simple and 200 hourly exponential moving averages.

    • Ether: bullish reversal seen above the $1181 mark
    • The short-term range appears to be mildly bullish
    • ETH continues to remain above the $1250 levels
    • The average true range is indicating HIGH market volatility

    VIEW FULL ANALYSIS VISIT - FXOpen Blog...

    Disclaimer: This forecast represents FXOpen Companies opinion only, it should not be construed as an offer, invitation or recommendation in respect to FXOpen Companies products and services or as financial advice.

    Offline FXOpen Trader

    • Hero Member
    • *
    • Activity: 851
    • points:
      52859
    • Karma: 0
    • Trade Count: (0)
    • Referrals: 0
    • Last Active: April 11, 2024, 12:55:29 PM
      • View Profile

    • Total Badges: 11
      Badges: (View All)
      Second year Anniversary 500 Posts One year Anniversary
    Re: Daily Market Analysis By FXOpen
    « Reply #326 on: January 06, 2023, 03:57:34 PM »
    Watch FXOpen's January 2 - 6 Weekly Market Wrap Video

    In this video, FXOpen UK COO Gary Thomson sums up the week’s happenings and discusses the most significant news reports.

    • What to expect in stock market in 2023
    • British pound crashes against USD
    • USD rally short-lived
    • Gold starts 2023 with strong growth

    Watch our short and informative video, and stay updated with FXOpen.


    FXOpen YouTube


    Disclaimer: This forecast represents FXOpen Companies opinion only, it should not be construed as an offer, invitation or recommendation in respect to FXOpen Companies products and services or as financial advice.

    Offline FXOpen Trader

    • Hero Member
    • *
    • Activity: 851
    • points:
      52859
    • Karma: 0
    • Trade Count: (0)
    • Referrals: 0
    • Last Active: April 11, 2024, 12:55:29 PM
      • View Profile

    • Total Badges: 11
      Badges: (View All)
      Second year Anniversary 500 Posts One year Anniversary
    Re: Daily Market Analysis By FXOpen
    « Reply #327 on: January 10, 2023, 03:08:37 PM »
    BTCUSD and XRPUSD Technical Analysis – 10th JAN 2023


    BTCUSD: Three Inside UP Pattern Above $16608

    Bitcoin was unable to sustain its bearish momentum and after touching a low of $16608 on 03rd Jan, the price started to correct upwards against the US dollar and is ranging above the $17200 handle in the European trading session today.

    We have seen a bullish opening of the markets this week.

    We can clearly see a three inside up pattern above the $16608 handle which is a bullish reversal pattern because it signifies the end of a downtrend and a shift towards an uptrend.

    Bitcoin touched an intraday low of 17133 in the Asian trading session and an intraday high of 17277 in the European trading session today.

    The price of bitcoin is back over the pivot point in the daily time frame.

    The ichimoku is indicating a bullish crossover with tenkan and kijun in the daily time frame.

    Both the STOCH and STOCHRSI are indicating overbought levels which means that in the immediate short term, a decline in the prices is expected.

    The relative strength index is at 55.92 indicating a STRONG demand for bitcoin, and the continuation of the buying pressure in the markets.

    Bitcoin is now moving above its 100 hourly simple moving average and above its 100 hourly exponential moving averages.

    Most of the major technical indicators are giving a BUY signal, which means that in the immediate short term, we are expecting targets of 17500 and 18500.

    The average true range is indicating LESS market volatility with a strong bullish momentum.

    • Bitcoin: bullish reversal seen above $16608
    • The average directional index is indicating a NEUTRAL level
    • The price is now trading just below its pivot level of $17261
    • The short-term range is strongly bullish

    Bitcoin: Bullish Reversal Seen Above $16608


    The price of bitcoin continues to rise above the $17000 handle and after some consolidation we are expecting the immediate targets of $18000 and $19000.

    There is an ascending channel forming with the current support at $16521 at which the price crosses 9-day moving average stalls.

    The Williams percent indicator is back over -50 indicating a bullish tone present in the markets.

    We can see the formation of a bullish trend reversal pattern with the adaptive moving average AMA20 in the 1-hour time frame.

    The immediate short-term outlook for bitcoin is strongly bullish, the medium-term outlook has turned bullish, and the long-term outlook remains neutral under present market conditions.

    Bitcoin’s support zone is located at $16802 at which the price crosses 18-day moving average, and $16926 which is a 1st Support point of the pivot point.

    The price of BTCUSD is now facing its classic resistance level of 17271 and Fibonacci resistance level of 17289 after which the path towards 18000 will get cleared.

    In the last 24hrs, BTCUSD has decreased by 0.08% by 14.08$ and has a 24hr trading volume of USD 15.993 billion. We can see an increase of 10.97% in the trading volume compared to yesterday, which appears to be normal.

    The Week Ahead

    Bitcoin’s price is expected to enter a super bullish zone after crossing the $18000 level with the next upwards targets located at $19000 and $20000.

    The daily RSI is printing at 60.20 which indicates a STRONG demand for bitcoin and the continuation of the bullish phase present in the markets in the short-term range.

    The price of BTCUSD is now facing its resistance zone located at $17429 which is a 3-10 day MACD oscillator stalls, and $17789 which is a 38.2% retracement from a 13-week low.

    The weekly outlook is projected at $18500 with a consolidation zone of $18000.

    Technical Indicators:

    The MACD (12,26): is at 25.00 indicating a BUY

    The commodity channel index, CCI (14): is at 135.50 indicating a BUY

    The rate of price change, ROC: is at 0.232 indicating a BUY

    Bull/Bear power (13): is at 24.49 indicating a BUY

    VIEW FULL ANALYSIS VISIT - FXOpen Blog...

    Disclaimer: This forecast represents FXOpen Companies opinion only, it should not be construed as an offer, invitation or recommendation in respect to FXOpen Companies products and services or as financial advice.

    Offline FXOpen Trader

    • Hero Member
    • *
    • Activity: 851
    • points:
      52859
    • Karma: 0
    • Trade Count: (0)
    • Referrals: 0
    • Last Active: April 11, 2024, 12:55:29 PM
      • View Profile

    • Total Badges: 11
      Badges: (View All)
      Second year Anniversary 500 Posts One year Anniversary
    Re: Daily Market Analysis By FXOpen
    « Reply #328 on: January 12, 2023, 03:07:35 PM »
    ETHUSD and LTCUSD Technical Analysis – 12th JAN, 2023


    ETHUSD: Bullish Harami Pattern Above $1237

    Ethereum was unable to sustain its bearish momentum and after touching a low of 1237 on 06th Jan, the price started to correct upwards against the US dollar crossing the $1400 handle today in the European trading session.

    The prices are ranging near a new record high of 1 month.

    We have seen a bullish opening in the markets this week.

    We can clearly see a bullish harami pattern above the $1237 handle which is a bullish pattern and signifies the end of a bearish phase and the start of a bullish phase in the markets.

    ETH is now trading just above its pivot level of 1398 and moving in a strongly bullish channel. The price of ETHUSD is now testing its classic resistance level of 1401 and Fibonacci resistance level of 1403 after which the path towards 1500 will get cleared.

    We have also seen the formation of an upside gap in the 15-minute time frame indicating the bullish nature of the markets.

    The relative strength index is at 70.66 indicating a strong demand for Ether and the continuation of the buying pressure in the markets.

    The Williams percent range is indicating an overbought market, which means that the price is expected to decline in the short-term range.

    Most of the technical indicators are giving a STRONG BUY market signal.

    Most of the moving averages are giving a STRONG BUY signal at the current market levels of $1399.

    ETH is now trading Above both the 100 hourly simple and 200 hourly exponential moving averages.

    • Ether: bullish reversal seen above the $1237 mark
    • The short-term range appears to be strongly bullish
    • ETH continues to remain above the $1350 level
    • The average true range is indicating HIGH market volatility

    Ether: Bullish Reversal Seen Above $1237


    ETHUSD continues to trade higher against the US dollar and bitcoin. The price of Ethereum remains supported above the $1300 level and now we are testing the break of the $1500 handle.

    The momentum Indicator is back over zero in the weekly time frame.

    We can see the formation of a bullish price crossover pattern with moving average MA20 in the weekly time frame.

    The resistance of the channel is broken in the daily time frame indicating bullish trends.

    ETHUSD touched an intraday low of 1341 in the Asian trading session and an intraday high of 1417 in the European trading session today.

    The daily RSI is printing at 75.77 indicating a STRONG demand for Ether in the long-term range.

    The key support levels to watch are $1275 at which the price crosses 9-day moving average and at $1313 which is a 38.2% retracement from a 4-week high.

    ETH has increased by 4.62% with a price change of 61.65$ in the past 24hrs and has a trading volume of 9.607 billion USD.

    We can see an increase of 74.76% in the total trading volume in the last 24 hrs which is due to the heavy buying pressure seen in the global markets.

    The Week Ahead

    ETH has already made a successful attempt at crossing the $1400 level and the next targets are located at $1500 and $1600 levels in the medium-term.

    We can see the formation of an ascending channel from $1237 towards $1421.

    The immediate short-term outlook for Ether has turned strongly bullish, the medium-term outlook has turned bullish, and the long-term outlook for Ether is neutral under present market conditions.

    The resistance zone is located at $1413 which is a 1-month high, and at $1442 which is a 38.2% retracement from a 13-week high.

    The weekly outlook is projected at $1550 with a consolidation zone of $1500.

    Technical Indicators:

    The STOCH (9,6): is at 57.42 indicating a BUY

    The MACD (12,26): is at 16.00 indicating a BUY

    The ultimate oscillator: is at 51.75 indicating a BUY

    The rate of price change: is at 4.24 indicating a BUY

    VIEW FULL ANALYSIS VISIT - FXOpen Blog...

    Disclaimer: This forecast represents FXOpen Companies opinion only, it should not be construed as an offer, invitation or recommendation in respect to FXOpen Companies products and services or as financial advice.

    Offline FXOpen Trader

    • Hero Member
    • *
    • Activity: 851
    • points:
      52859
    • Karma: 0
    • Trade Count: (0)
    • Referrals: 0
    • Last Active: April 11, 2024, 12:55:29 PM
      • View Profile

    • Total Badges: 11
      Badges: (View All)
      Second year Anniversary 500 Posts One year Anniversary
    Re: Daily Market Analysis By FXOpen
    « Reply #329 on: January 13, 2023, 07:15:19 PM »
    Watch FXOpen's January 9 - 13 Weekly Market Wrap Video

    In this video, FXOpen UK COO Gary Thomson sums up the week’s happenings and discusses the most significant news reports.

    • Major events of the coming days
    • GBP/USD and GBP/JPY aim higher
    • FTSE 100 rockets to 1 year high! Will it reach 8,000?
    • The financial market is preparing for a shake-up

    Watch our short and informative video, and stay updated with FXOpen.


    FXOpen YouTube


    Disclaimer: This forecast represents FXOpen Companies opinion only, it should not be construed as an offer, invitation or recommendation in respect to FXOpen Companies products and services or as financial advice.


    ETH & ERC20 Tokens Donations: 0x2143F7146F0AadC0F9d85ea98F23273Da0e002Ab
    BNB & BEP20 Tokens Donations: 0xcbDAB774B5659cB905d4db5487F9e2057b96147F
    BTC Donations: bc1qjf99wr3dz9jn9fr43q28x0r50zeyxewcq8swng
    BTC Tips for Moderators: 1Pz1S3d4Aiq7QE4m3MmuoUPEvKaAYbZRoG
    Powered by SMFPacks Social Login Mod