follow us on twitter . like us on facebook . follow us on instagram . subscribe to our youtube channel . announcements on telegram channel . ask urgent question ONLY . Subscribe to our reddit . Altcoins Talks Shop Shop


This is an Ad. Advertised sites are not endorsement by our Forum. They may be unsafe, untrustworthy, or illegal in your jurisdiction. Advertise Here

Author Topic: Daily Market Analysis By FXOpen  (Read 46501 times)

Offline FXOpen Trader

  • Hero Member
  • *
  • Activity: 851
  • points:
    52859
  • Karma: 0
  • Trade Count: (0)
  • Referrals: 0
  • Last Active: April 11, 2024, 12:55:29 PM
    • View Profile

  • Total Badges: 11
    Badges: (View All)
    Second year Anniversary 500 Posts One year Anniversary
Re: Daily Market Analysis By FXOpen
« Reply #180 on: May 23, 2022, 12:05:18 PM »
GBP/USD and GBP/JPY Could Rise Steadily

GBP/USD started a fresh increase above the 1.2400 resistance zone. GBP/JPY is consolidating and might rise steadily above the 160.50 resistance zone.

Important Takeaways for GBP/USD and GBP/JPY

  • The British Pound started a fresh increase above the 1.2420 resistance against the US Dollar.
  • There is a key bullish trend line forming with support near 1.2465 on the hourly chart of GBP/USD.
  • GBP/JPY is showing positive signs above the 158.50 and 159.00 support levels.
  • There is a major bullish trend line forming with support near 159.20 on the hourly chart.

GBP/USD Technical Analysis

This past week, the British Pound formed a base above the 1.2150 level against the US Dollar. The GBP/USD pair started a steady increase above the 1.2200 and 1.2320 resistance levels.

There was also a clear move above the 1.2450 resistance and the 50 hourly simple moving average. The recent price action was bullish, and the pair even climbed above the 1.236 Fib extension level of the downward move from the 1.2500 swing high to 1.2329 low (formed on FXOpen).

GBP/USD Hourly Chart


It is now consolidating above the 1.2500 level. On the upside, the pair is facing resistance near the 1.2550 level. The next major hurdle is near the 1.2600 level.

The 1.618 Fib extension level of the downward move from the 1.2500 swing high to 1.2329 low is also near the 1.2600 zone. An upside break above 1.2600 could set the pace for a move towards the 1.2720 resistance zone.

If there is no upside break above 1.2600, the pair could start a fresh decline. An immediate support is near the 1.2500. The next major support is near the 1.2450 level.

There is also a key bullish trend line forming with support near 1.2465 on the hourly chart of GBP/USD.  If there is a break below the 1.2450 support, the pair could test the 1.2320 support.

Read Full on FXOpen Company Blog...

Altcoins Talks - Cryptocurrency Forum

Re: Daily Market Analysis By FXOpen
« Reply #180 on: May 23, 2022, 12:05:18 PM »

This is an Ad. Advertised sites are not endorsement by our Forum. They may be unsafe, untrustworthy, or illegal in your jurisdiction. Advertise Here


Offline FXOpen Trader

  • Hero Member
  • *
  • Activity: 851
  • points:
    52859
  • Karma: 0
  • Trade Count: (0)
  • Referrals: 0
  • Last Active: April 11, 2024, 12:55:29 PM
    • View Profile

  • Total Badges: 11
    Badges: (View All)
    Second year Anniversary 500 Posts One year Anniversary
Re: Daily Market Analysis By FXOpen
« Reply #181 on: May 23, 2022, 09:04:18 PM »
ECB Hints At Positive Rates, Sending EUR Higher


The euro started the trading week on a higher note after the ECB President, Christine Lagarde, said that the central bank is ready to raise the rates during the summer. In a blog posted on the ECB’s website, Lagarde said that the lift-off date is drawing closer, and it is important for the markets to know the policy normalization path ahead.

Euro needed nothing more to rally. The EUR/USD, as seen below, jumped over 100 pips or more than 1% on the news. Traders now expect that the ECB will raise the key interest rate twice in July and once in September, bringing the deposit facility rate to zero.


ECB Prepares for the Ending of Negative Rates

It is a milestone for the ECB. The central bank has kept the interest rate below zero for many years, but now it fears that a weaker currency might add to inflation.

It is calculated that the euro depreciation since March 2022 alone could add another 10bp on inflation this year and 20bp in the year to come. Hence, the ECB wanted to make sure that the markets know it is not tolerating inflation much higher than its price stability definition.

As a consequence, the euro rallied across the board. It gained against all its peers, not only against the US dollar.

But the EUR/USD is the exchange rate that matters. To be able to gain against the dollar at a time when the Fed is hiking the rates aggressively is something to take into account by traders.

Euro traded as high as 1.23 against the dollar only twelve months ago. The rapid depreciation to below 1.04 worried the ECB, as it fuels higher inflation.

As such, the news that the central bank plans the normalization of its policy should not come as a surprise, despite the war in Ukraine. ECB has the mandate to deal with price stability, and the only way to do so is to raise the rates to combat inflation.

All in all, today’s news confirms that the ECB joined the hawkish camp. The big question in the months ahead would be if the summer rate hikes are all the ECB is willing to do, or some more await after September?

FXOpen Blog

Offline FXOpen Trader

  • Hero Member
  • *
  • Activity: 851
  • points:
    52859
  • Karma: 0
  • Trade Count: (0)
  • Referrals: 0
  • Last Active: April 11, 2024, 12:55:29 PM
    • View Profile

  • Total Badges: 11
    Badges: (View All)
    Second year Anniversary 500 Posts One year Anniversary
Re: Daily Market Analysis By FXOpen
« Reply #182 on: May 24, 2022, 08:32:40 PM »
BTCUSD and XRPUSD Technical Analysis – 24th MAY 2022


BTCUSD: Triple-Top Pattern Below $30,775

Bitcoin was not able to sustain its bullish momentum this week, and after touching a high of 30,652 on 23rd May, started to decline heavily against the US dollar; it touched a low of 28,860 today in the Asian trading session.

The drop that we saw continues, and now the prices have entered a consolidation channel above the $29,000 handle in the European trading session.

If we see some buying at these levels, the prices will continue to remain above them in the short-term range. But in the medium-term range, we are expecting a further drop due to weak global demand cues.

We can clearly see a triple-top pattern below the $30б775 handle which is a bearish reversal pattern because it signifies the end of an uptrend and a shift towards a downtrend.

Both the STOCH and STOCHRSI are indicating overbought levels which means that in the immediate short term, a decline in the prices is expected.

The relative strength index is at 40 indicating a WEAK demand for bitcoin at the current market levels.

Bitcoin is now moving below its 100 and 200 hourly simple MAs.

Most of the major technical indicators are giving a SELL signal, which means that in the immediate short term, we are expecting targets of 28,000 and 27,500.

The average true range is indicating LESS market volatility with a mild bearish momentum.

  • Bitcoin: bearish reversal seen below $30,775
  • The Williams percent range is indicating an OVERBOUGHT level
  • The price is now trading just above its pivot level of $29,229
  • All of the MAs are giving a STRONG SELL market signal

Bitcoin: Bearish Reversal Seen Below $30,775


Bitcoin continues to move in a consolidation channel above the $29,000 handle in the European trading session today. We can see the formation of a demand zone above it, but the global risk scenarios may enable further decline in the prices this week.

The immediate short-term outlook for bitcoin is mildly bearish; the medium-term outlook has turned neutral; and the long-term outlook remains neutral under present market conditions.

Bitcoin continues to consolidate above its important support level of $29,000, and with increasing demand zone formation the immediate target is $30,500.

The price of BTCUSD is now facing its classic support level of 28,819 and Fibonacci support level of 29,135, after which the path towards 28,000 will get cleared.

In the last 24hrs, BTCUSD has decreased by 3.97% with a price change of 1,210$, and has a 24hr trading volume of USD 31.034 billion. We can see an Increase of 1.58% in the trading volume as compared to yesterday, which appears to be normal.

The Week Ahead

The prices of bitcoin are moving in a mildly bearish momentum, and the immediate targets are $28,000 and $27,500.

The daily RSI is printing at 37 which means that the medium range demand continues to be weak.

We are now expecting a range-bound movement between $28,000 and $32,000 next week.

The price of BTCUSD will need to remain above the important support level of $29,000 this week.

The weekly outlook is projected at $31,500 with a consolidation zone of $30,000.

Technical Indicators:

The moving averages convergence divergence (12,26): at -161 indicating a SELL

The average directional change (14-day): at 34.90 indicating a NEUTRAL level

The rate of price change: at -0.006 indicating a SELL

The commodity channel index (14-day): at 42.96 indicating a NEUTRAL level

Read Full on FXOpen Company Blog...

Offline FXOpen Trader

  • Hero Member
  • *
  • Activity: 851
  • points:
    52859
  • Karma: 0
  • Trade Count: (0)
  • Referrals: 0
  • Last Active: April 11, 2024, 12:55:29 PM
    • View Profile

  • Total Badges: 11
    Badges: (View All)
    Second year Anniversary 500 Posts One year Anniversary
Re: Daily Market Analysis By FXOpen
« Reply #183 on: May 26, 2022, 07:44:37 PM »
ETHUSD and LTCUSD Technical Analysis – 26th MAY, 2022


ETHUSD: Bearish Engulfing Pattern Below $2,087

Ethereum was unable to sustain its bullish momentum last week, and after touching a high of 2,084 on 23rd May started to decline heavily against the US dollar.

We can see a strong bearish momentum this week and this is putting downward pressure on the prices of Ethereum below the 1,850 handle in the European trading session today.

We can see the formation of a major bearish trend line today on the hourly chart, and the pair is poised to decline further given the weak investor sentiments.

The prices touched an intraday low of $1,817 in the Asian trading session and an intraday high of $1,970 in the European trading session today.

We can clearly see a bearish engulfing pattern below the $2,087 handle which is a bearish pattern and signifies the end of a bullish phase and the start of a bearish phase in the markets.

ETH is now trading just below its pivot level of 1,860 and moving into a strong bearish channel. The price of ETHUSD is now testing its classic support level of 1,686 and Fibonacci support level of 1,819 after which the path towards 1,700 will get cleared.

The relative strength index is at 21 indicating an OVERSOLD market, and the possibility of a pullback action.

The StochRSI and Williams percent range are indicating an oversold level which means that the prices are due to correct upwards in the short-term range.

ALL of the technical indicators are giving a STRONG SELL market signal.

All of the MAs are giving a STRONG SELL signal, and we are now looking at the levels of $1,700 to $1,650 in the short-term range.

ETH is now trading below both the 100 hourly and exponential MAs.

  • A bearish reversal seen below the $2,087 mark
  • The short-term range appears to be strongly BEARISH
  • The daily RSI is below 50 at 21 indicating a bearish market
  • The average true range is indicating HIGH market volatility

Ether: Bearish Continuation Seen Below $2,087


ETHUSD is now moving into a strong bearish channel with the prices trading below the $1,850 handle in the European trading session today.

We can see that the commodity channel index is at an oversold level now, which means that a potential bullish reversal is possible anytime in the markets.

The price of Ethereum may continue to decline further against the US dollar due to the global risk scenario and the flight towards the safe haven assets like the US Dollar and GOLD.

The key resistance levels to watch are $1,941 and $2,260, and the price of ETHUSD needs to cross these levels for a potential Bullish reversal.

ETH has declined by 6.91% with a price change of 136$ in the past 24hrs, and has a trading volume of 15.808 Billion USD.

We can see an Increase of 13.21% in the total trading volume in the last 24 hrs which appears to be normal.

The Week Ahead

Global investors are now looking to liquidate their holdings in the cryptocurrencies, which is the main reason for the continuous fall in the price of Ethereum. The ETH 2.0 planned upgrade has also not been activated, leading to concerns about the future of Ethereum and its market value.

The immediate short-term outlook for Ether has turned strongly BEARISH; the medium-term outlook has turned BEARISH; and the long-term outlook for Ether is NEUTRAL in present market conditions.

This week, Ether is expected to move in a range between $1,600 and $1,800, and next week, it is expected to enter into a consolidation phase above the $1,800 level.

Technical Indicators:

The Williams percent range: at -96.16 indicating an OVERSOLD level

The moving averages convergence divergence (12,26): at -25.11 indicating a SELL

The ultimate oscillator: at 33.56 indicating a SELL

The rate of price change: at -6.37 indicating a SELL

Read Full on FXOpen Company Blog...

Offline FXOpen Trader

  • Hero Member
  • *
  • Activity: 851
  • points:
    52859
  • Karma: 0
  • Trade Count: (0)
  • Referrals: 0
  • Last Active: April 11, 2024, 12:55:29 PM
    • View Profile

  • Total Badges: 11
    Badges: (View All)
    Second year Anniversary 500 Posts One year Anniversary
Re: Daily Market Analysis By FXOpen
« Reply #184 on: May 27, 2022, 06:59:19 AM »
Gold Price and Oil Price Eye More Upsides


Gold price started a fresh increase from the $1,810 level. Crude oil price is rising and might gain pace above the $113.75 resistance.

Important Takeaways for Gold and Oil

  • Gold price started a decent increase after it formed a base above $1,810 against the US Dollar.
  • There is a key bullish trend line forming with support near $1,845 on the hourly chart of gold.
  • Crude oil price gained pace after it broke the $108 and $110 resistance levels.
  • There is a major bullish trend line forming with support near $111.10 on the hourly chart of XTI/USD.

Gold Price Technical Analysis

Gold price formed a base above the $1,800 and $1,810 levels against the US Dollar. The price started a fresh increase after it broke the $1,825 resistance zone.

There was a clear move above the $1,840 level and the 50 hourly simple moving average. The price even cleared the $1,850 level and traded as high as $1,869 on FXOpen. Recently, there was a downside correction below $1,850, but the bulls protected $1,840.

Gold Price Hourly Chart


A low is formed near $1,840 and the price is now rising. There was a move above the 50% Fib retracement level of the downward move from the $1,869 swing high to $1,840 low.

On the upside, the price is facing resistance near the $1,858 level. It is near the 61.8% Fib retracement level of the downward move from the $1,869 swing high to $1,840 low. The main resistance is now forming near the $1,870 level.

A close above the $1,870 level could open the doors for a steady increase towards $1,880. The next major resistance sits near the $1,900 level.

On the downside, an initial support is near the $1,850 level. The next major support is near the $1,845 level. There is also a key bullish trend line forming with support near $1,845 on the hourly chart of gold, below which there is a risk of a larger decline.

Read Full on FXOpen Company Blog...

Offline FXOpen Trader

  • Hero Member
  • *
  • Activity: 851
  • points:
    52859
  • Karma: 0
  • Trade Count: (0)
  • Referrals: 0
  • Last Active: April 11, 2024, 12:55:29 PM
    • View Profile

  • Total Badges: 11
    Badges: (View All)
    Second year Anniversary 500 Posts One year Anniversary
Re: Daily Market Analysis By FXOpen
« Reply #185 on: May 30, 2022, 02:09:36 PM »
GBP/USD Gains Pace While EUR/GBP Faces Key Hurdle


GBP/USD started a decent increase above the 1.2550 resistance. EUR/GBP is struggling to clear the 0.8500 and 0.8520 resistance levels.

Important Takeaways for GBP/USD and EUR/GBP

  • The British Pound started a decent increase above 1.2550 against the US Dollar.
  • There was a break above a key contracting triangle with resistance near 1.2640 on the hourly chart of GBP/USD.
  • EUR/GBP is holding the 0.8480 support but struggling above 0.8500.
  • There was a break above a major bearish trend line with resistance near 0.8500 on the hourly chart.

GBP/USD Technical Analysis

The British Pound remained well bid above the 1.2400 zone against the US Dollar. The GBP/USD pair started a decent increase after it broke the 1.2500 resistance.

There was a clear move above the 1.2550 level and the 50 hourly simple moving average. The bulls were even able to clear the 1.2600 resistance. Recently, there was a break above a key contracting triangle with resistance near 1.2640 on the hourly chart of GBP/USD.

GBP/USD Hourly Chart


The pair traded as high as 1.2663 and is currently consolidating above the 50% Fib retracement level of the recent decline from the 1.2663 swing high to 1.2585 low.

On the upside, an initial resistance is near the 1.2650 level. It is near the 76.4% Fib retracement level of the recent decline from the 1.2663 swing high to 1.2585 low. The next main resistance is near the 1.2665 zone.

A clear upside break above the 1.2665 and 1.2680 resistance levels could open the doors for a steady increase in the near term. The next major resistance sits near the 1.2750 level.

If not, the pair might start a downside correction below 1.2620. The next major support is near the 1.2600 level. Any more losses could lead the pair towards the 1.2550 support zone or even 1.2520.

Read Full on FXOpen Company Blog...

Offline FXOpen Trader

  • Hero Member
  • *
  • Activity: 851
  • points:
    52859
  • Karma: 0
  • Trade Count: (0)
  • Referrals: 0
  • Last Active: April 11, 2024, 12:55:29 PM
    • View Profile

  • Total Badges: 11
    Badges: (View All)
    Second year Anniversary 500 Posts One year Anniversary
Re: Daily Market Analysis By FXOpen
« Reply #186 on: June 01, 2022, 01:58:17 AM »
BTCUSD and XRPUSD Technical Analysis – 31st MAY 2022


BTCUSD: Bullish Pennant Pattern Above $28,000

Bitcoin was not able to sustain its bearish momentum this week, and after touching a low of 28,009 on 26th May, started to move upwards due to the formation of demand zones above these levels.

Bitcoin entered into a consolidation channel above the $28,000 handle and then corrected upwards touching a high of 32,192 in the European trading session today.

The global investor sentiment has improved from last week, leading to fresh buying by the long-term investors and now we are looking at levels of $32,500 and $35,000.

We can clearly see a bullish pennant pattern above the $28,000 handle which is a bullish reversal pattern because it signifies the end of a downtrend and a shift towards an uptrend.

Both the STOCH and Williams percent range are indicating an overbought level which means that in the immediate short term, a decline in the prices is expected.

The relative strength index is at 68 indicating a STRONG demand for bitcoin at the current market levels.

Bitcoin is now moving above its 100 hourly simple and 200 hourly simple MAs.

ALL of the major technical indicators are giving a STRONG BUY signal, which means that in the immediate short term, we are expecting targets of 32,000 and 33,500.

The average true range is indicating LESS market volatility with a strongly bullish momentum.

  • Bitcoin: bullish reversal seen above $28,000.
  • The StochRSI is indicating an OVERSOLD level.
  • The price is now trading just above its pivot level of $31,545.
  • All of the moving averages are giving a STRONG BUY market signal.

Bitcoin: Bullish Reversal Seen Above $28,000


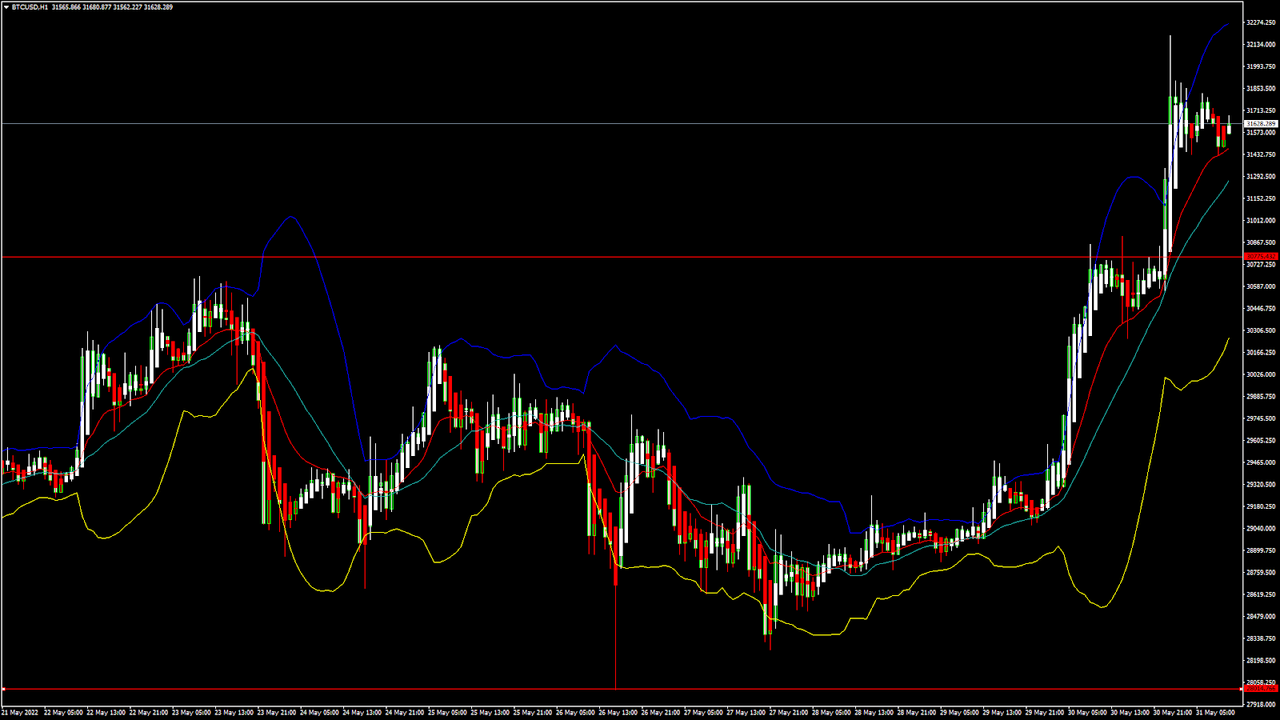
Bitcoin continues to move into a consolidation channel above the $31,500 handle in the European trading session today.

We can see the formation of a rising trend channel above the $28,000 handle, and now we are looking at the projected levels of $33,000 and $35,000.

The immediate short-term outlook for bitcoin is strongly bullish; the medium-term outlook has turned bullish; and the long-term outlook remains neutral under present market conditions.

Bitcoin continues to consolidate above its important support level of $31,000 and with increasing demand zone formation the immediate target is $32,500

The price of BTCUSD is now facing its classic resistance level of 31,614 and Fibonacci resistance level of 31,653, after which the path towards 32,000 will get cleared.

In the last 24hrs, BTCUSD has increased by 3.05% with a price change of $937, and has a 24hr trading volume of USD 37.468 billion. We can see an Increase of 39.80% in the trading volume as compared to yesterday, which is due to the fresh buying seen at lower levels.

The Week Ahead

The price of bitcoin is moving in a strongly bullish momentum, and the immediate targets are $32,000 and $33,500.

The daily RSI is printing at 50 which means that the medium range demand continues to be NEUTRAL.

We are now looking at a fresh rally into the markets with targets of $33,500 and $35,000 next week.

The prices of BTCUSD will need to remain above the important support levels of $31,000 this week.

The weekly outlook is projected at $33,500 with a consolidation zone of $32,000.

Technical Indicators:

The moving averages convergence divergence (12,26): at 390 indicating a BUY

The average directional change (14 days): at 45.56 indicating a BUY

The rate of price change: at 3.12 indicating a BUY

The commodity channel index (14 days): at 45.18 indicating a NEUTRAL level

Read Full on FXOpen Company Blog...

Altcoins Talks - Cryptocurrency Forum

Re: Daily Market Analysis By FXOpen
« Reply #186 on: June 01, 2022, 01:58:17 AM »


Offline FXOpen Trader

  • Hero Member
  • *
  • Activity: 851
  • points:
    52859
  • Karma: 0
  • Trade Count: (0)
  • Referrals: 0
  • Last Active: April 11, 2024, 12:55:29 PM
    • View Profile

  • Total Badges: 11
    Badges: (View All)
    Second year Anniversary 500 Posts One year Anniversary
Re: Daily Market Analysis By FXOpen
« Reply #187 on: June 01, 2022, 07:41:15 AM »
EUR/USD Could Dip While USD/JPY Aims More Gains


EUR/USD struggled near 1.0785 and corrected lower. USD/JPY is rising and might continue to gain pace towards the 130.20 resistance

Important Takeaways for EUR/USD and USD/JPY

  • The Euro started a downside correction after it failed to surpass 1.0785.
  • There is a key bearish trend line forming with resistance near 1.0725 on the hourly chart of EUR/USD.
  • USD/JPY gained pace after it broke the 127.50 resistance zone.
  • It surpassed a major bearish trend line with resistance near 127.55 on the hourly chart.

EUR/USD Technical Analysis

This past week, the Euro started a decent recovery wave above the 1.0680 level against the US Dollar. The EUR/USD pair cleared the 1.0720 and 1.0740 resistance levels.

However, the pair faced sellers near the 1.0785 level. A high was formed near 1.0786 on FXOpen and EUR/USD started a downside correction. There was a move below the 1.0740 support and the 50 hourly simple moving average.

EUR/USD Hourly Chart


A low was formed near 1.0679 and the pair is now correcting higher. There was a move above the 1.0700 resistance level. It even spiked above the 50% Fib retracement level of the downward move from the 1.0786 swing high to 1.0679 low.

However, the pair failed to gain pace above the 1.0740 level. It failed near the 61.8% Fib retracement level of the downward move from the 1.0786 swing high to 1.0679 low.

There is also a key bearish trend line forming with resistance near 1.0725 on the hourly chart of EUR/USD. It is now moving lower and trading below 1.0710. An immediate resistance on the upside is near the 1.0725 level.

The next major resistance is near the 1.0740 level. The main resistance is near the 1.0785 level. An upside break above 1.0785 could set the pace for a steady increase.

If not, the pair might drop and test the 1.0675 support. The next major support is near 1.0650, below which the pair could drop to 1.0580 in the near term.

Read Full on FXOpen Company Blog...

Offline FXOpen Trader

  • Hero Member
  • *
  • Activity: 851
  • points:
    52859
  • Karma: 0
  • Trade Count: (0)
  • Referrals: 0
  • Last Active: April 11, 2024, 12:55:29 PM
    • View Profile

  • Total Badges: 11
    Badges: (View All)
    Second year Anniversary 500 Posts One year Anniversary
Re: Daily Market Analysis By FXOpen
« Reply #188 on: June 02, 2022, 05:26:28 PM »
ETHUSD AND LTCUSD Technical Analysis – 02nd JUNE, 2022


ETHUSD: Bearish Engulfing Pattern Below $2015

Ethereum was unable to sustain its bullish momentum last week and after touching a high of 2011 on 31st May started to decline heavily against the US Dollar.

We can see a strong bearish momentum this week and this is putting downwards pressure on the prices of Ethereum below the 1850 handle in the European Trading session today.

We can see the formation of a Major bearish trend line today on the hourly chart and the pair is poised to decline further given the weak investor sentiments.

The prices touched an Intraday Low of $1794 in the Asian trading session and an Intraday High of $1843 in the European Trading session today.

We can clearly see a Bearish Engulfing Pattern Below the $2015 handle which is a Bearish pattern and signifies the end of a Bullish phase and the start of a Bearish phase in the markets.

ETH is now trading just above its Pivot levels of 1817 and is moving into a Strong bearish channel. The price of ETHUSD is now testing its Classic support levels of 1767 and Fibonacci support levels of 1805 after which the path towards 1700 will get cleared.

Relative Strength Index is at 40 indicating a WEAK market and the continuation of the decline after the consolidation phase gets over.

The STOCHRSI is indicating Oversold levels which means that the prices are due to correct upwards in the short-term range.

ALL of the of the Technical indicators are giving a STRONG SELL market Signal.

All of the Moving Averages are giving a STRONG SELL Signal and we are now looking at the levels of $1700 to $1600 in the short-term range.

ETH is now trading Below its both the 100 Hourly and Exponential Moving Averages.

  • Ether Bearish Reversal seen below the $2015 mark.
  • Short-term range appears to be Strongly BEARISH.
  • Daily RSI is Below 50 at 38 indicating a Bearish market.
  • Average True Range is indicating HIGH Market Volatility.

Ether Bearish Continuation Seen Below $2015


ETHUSD is now moving into a Strong Bearish channel with the prices trading below the $1850 handle in the European Trading session today.

We can see the formation of a Major Bearish trend line in the hourly chart which suggests that further decline in the prices of Ethereum are expected.

The prices of Ethereum are moving into a consolidation channel now and after the consolidation phase is over a further decline in its levels is expected.

The key resistance levels to watch are $1919 and $2046 and the prices of ETHUSD need to cross these levels for a potential Bullish reversal.

ETH has declined by 5.80% with a price change of 112$ in the past 24hrs and has a trading volume of 21.678 Billion USD.

We can see an Increase of 22.75% in the total trading volume in last 24 hrs. which is due to the continuation of the selling pressure across the global markets.

The Week Ahead

The global investor sentiments are weak and they are not willing to enter into the markets now, which is the main reason for the continuous fall in the prices of the Ethereum.

The delay in the implementation of the ETH 2.0 upgrade continues to affect the prices of Ethereum in the short-term range.

The immediate short-term outlook for the Ether has turned as Strongly BEARISH, the medium-term outlook has turned BEARISH, and the long-term outlook for Ether is NEUTRAL in present market conditions.

In this week Ether is expected to move in a range between the $1600 and $1800 and in the next week Ether is expected to enter into a Consolidation phase above the $1800 levels.

Technical Indicators:

Williams Percent Range: It is at -78.90 indicating a SELL.

Moving Averages Convergence Divergence (12,26): It is at -16.00 indicating a SELL.

Ultimate Oscillator: It is at 40.51 indicating a SELL.

Rate of Price Change: It is at -4.16 indicating a SELL.

Read Full on FXOpen Company Blog...

Offline FXOpen Trader

  • Hero Member
  • *
  • Activity: 851
  • points:
    52859
  • Karma: 0
  • Trade Count: (0)
  • Referrals: 0
  • Last Active: April 11, 2024, 12:55:29 PM
    • View Profile

  • Total Badges: 11
    Badges: (View All)
    Second year Anniversary 500 Posts One year Anniversary
Re: Daily Market Analysis By FXOpen
« Reply #189 on: June 03, 2022, 07:12:44 AM »
AUD/USD and NZD/USD Remain Supported for More Gains


AUD/USD extended increase above the 0.7200 resistance. NZD/USD is also showing a lot of positive signs above the 0.6500 level.

Important Takeaways for AUD/USD and NZD/USD

  • The Aussie Dollar started a fresh increase from the 0.7150 support zone against the US Dollar.
  • There was a break above a short-term contracting triangle with resistance near 0.7162 on the hourly chart of AUD/USD.
  • NZD/USD also started a decent increase after it cleared the 0.6500 resistance zone.
  • There was a move above a major bearish trend line with resistance near 0.6520 on the hourly chart of NZD/USD.

AUD/USD Technical Analysis

The Aussie Dollar formed a base above the 0.7150 level and started a fresh increase against the US Dollar. The AUD/USD pair gained pace for a move above the 0.7185 resistance zone.

There was a break above a short-term contracting triangle with resistance near 0.7162 on the hourly chart of AUD/USD. The pair even settled above the 0.7240 level and the 50 hourly simple moving average.

AUD/USD Hourly Chart


It traded as high as 0.7282 on FXOpen and is currently correcting gains. There was a move below the 0.7270 support zone.

However, the pair is still above the 23.6% Fib retracement level of the upward move from the 0.7140 swing low to 0.7282 high. On the downside, an initial support is near the 0.7250 level.

The next support could be the 0.7230 level. The main support is near the 0.7210 level and the 50 hourly simple moving average. It is close to the 50% Fib retracement level of the upward move from the 0.7140 swing low to 0.7282 high.

If there is a downside break below the 0.7210 support, the pair could extend its decline towards the 0.7150 level. Any more downsides might send the pair toward the 0.7080 level.

On the upside, the AUD/USD pair is facing resistance near the 0.7280 level. The next major resistance is near the 0.7320 level. A close above the 0.7320 level could start a steady increase in the near term. The next major resistance could be 0.7450.

Read Full on FXOpen Company Blog...

Offline FXOpen Trader

  • Hero Member
  • *
  • Activity: 851
  • points:
    52859
  • Karma: 0
  • Trade Count: (0)
  • Referrals: 0
  • Last Active: April 11, 2024, 12:55:29 PM
    • View Profile

  • Total Badges: 11
    Badges: (View All)
    Second year Anniversary 500 Posts One year Anniversary
Re: Daily Market Analysis By FXOpen
« Reply #190 on: June 06, 2022, 01:07:00 PM »
GBP/USD and USD/CAD At Risk of More Losses


GBP/USD started a fresh decline below the 1.2560 support. USD/CAD is also moving lower and might extend losses below the 1.2550 support.

Important Takeaways for GBP/USD and USD/CAD

  • The British Pound started a fresh decline from the 1.2655 resistance zone.
  • There is a major bearish trend line forming with resistance near 1.2540 on the hourly chart of GBP/USD.
  • USD/CAD also started a fresh increase from well below the 1.2800 zone.
  • There is a key bearish trend line forming with resistance near 1.2610 on the hourly chart.

GBP/USD Technical Analysis

After struggling to clear the 1.2655 resistance zone, the British Pound found started a fresh decline against the US Dollar. GBP/USD traded below the 1.2550 support level to move into a bearish zone.

The bears gained strength for a move below the 1.2500 level and the 50 hourly simple moving average. The pair even spiked below the 1.2480 level and traded as low as 1.2477 on FXOpen. The pair is now consolidating losses above the 1.2480 level.

GBP/USD Hourly Chart


An immediate resistance is near the 1.2505 level. It is near the 23.6% Fib retracement level of the downward move from the 1.2589 swing high to 1.2477 low.

The next key resistance is near the 1.2535 level. It is near the 50% Fib retracement level of the downward move from the 1.2589 swing high to 1.2477 low. There is also a major bearish trend line forming with resistance near 1.2540 on the hourly chart of GBP/USD.

If there is an upside break above the 1.2540 zone, the pair could rise towards 1.2600. The next key resistance could be 1.2655, above which the pair could gain strength.

On the downside, an initial support is near the 1.2475 area. The first major support is near the 1.2450 level. If there is a break below 1.2450, the pair could extend its decline. The next key support is near the 1.2400 level. Any more losses might call for a test of the 1.2320 support.

Read Full on FXOpen Company Blog...

Offline FXOpen Trader

  • Hero Member
  • *
  • Activity: 851
  • points:
    52859
  • Karma: 0
  • Trade Count: (0)
  • Referrals: 0
  • Last Active: April 11, 2024, 12:55:29 PM
    • View Profile

  • Total Badges: 11
    Badges: (View All)
    Second year Anniversary 500 Posts One year Anniversary
Re: Daily Market Analysis By FXOpen
« Reply #191 on: June 08, 2022, 04:03:28 AM »
BTCUSD and XRPUSD Technical Analysis – 07th JUNE 2022


BTCUSD: Bearish Doji Star Pattern Below $31,750

Bitcoin was not able to sustain its bullish momentum this week and after touching a high of 31,730 on 06th June, started to decline against the US dollar.

Bitcoin entered into a bearish trend channel below the $31,750 handle and continues to decline touching a low of 29,217 in the European trading session today.

We can see a weak demand for bitcoin in the medium-term range, and the prices are expected to fall further towards the $25,000 level.

We can clearly see a bearish doji star pattern below the $31,750 handle which is a bearish reversal pattern because it signifies the end of an uptrend and a shift towards a downtrend.

Both the Stoch and Williams percent range are indicating an overbought level which means that in the immediate short term a decline in the prices is expected.

The relative strength index is at 29 indicating a WEAK demand for Bitcoin at the current market levels.

Bitcoin is now moving below its 100 hourly and 200 hourly simple MAs.

All of the major technical Indicators are giving a STRONG SELL signal, which means that in the immediate short term we are expecting targets of 28,000 and 27,500.

The average true range is indicating LESS market volatility with a strong bearish momentum.

  • Bitcoin: bearish reversal seen below $31,750
  • The StochRSI is indicating an OVERSOLD level
  • The price is now trading just below its pivot level of $29,643
  • All of the moving averages are giving a STRONG SELL market signal

Bitcoin: Bearish Reversal Seen Below $31,750


Bitcoin continues to move into a consolidation channel above the $29,500 handle in the European trading session today.

We can see the formation of a falling trend channel below the $30,000 handle and now we are looking at the projected levels of $28,000 and $25,000.

The immediate short-term outlook for bitcoin is strongly bearish; the medium-term outlook has turned bearish; and the long-term outlook remains neutral under present market conditions.

Bitcoin continues to consolidate above its important support level of $29,000 and further decline in its price is expected in the US trading session.

The price of BTCUSD is now facing its classic support level of 29,361 and Fibonacci support level of 29,571 after which the path towards 28,000 will get cleared.

In the last 24hrs, BTCUSD has declined by 5.64% with a price change of 17,71$ and has a 24hr trading volume of USD 35.441 billion. We can see an Increase of 31.14 % in the trading volume as compared to yesterday, which is due to selling by the medium-term investors.

The Week Ahead

The price of bitcoin is moving in a strongly bearish momentum, and the immediate targets are $28,000 and $27,500.

The daily RSI is printing at 44 which means that the medium-range demand continues to be NEUTRAL.

The price of bitcoin is moving in an uncertain range-bound movement between the $28,000 and $32,000 over the past few weeks. We will have to wait till a clear trend is visible in the medium-term range.

The prices of BTCUSD will need to remain above the important support level of $29,000 this week.

The weekly outlook is projected at $29,500 with a consolidation zone of $28,000.

Technical Indicators:

Moving averages convergence divergence (12,26): at -344 indicating a SELL

The ultimate oscillator: at 44.88 indicating a SELL

The rate of price change: at -5.92 indicating a SELL

The commodity channel index (14 days): at -52.34 indicating a SELL

Read Full on FXOpen Company Blog...

Offline FXOpen Trader

  • Hero Member
  • *
  • Activity: 851
  • points:
    52859
  • Karma: 0
  • Trade Count: (0)
  • Referrals: 0
  • Last Active: April 11, 2024, 12:55:29 PM
    • View Profile

  • Total Badges: 11
    Badges: (View All)
    Second year Anniversary 500 Posts One year Anniversary
Re: Daily Market Analysis By FXOpen
« Reply #192 on: June 08, 2022, 07:19:01 AM »
EUR/USD Might Drop, USD/CHF Gains Bullish Momentum


EUR/USD is slowly moving lower below 1.0750. USD/CHF is rising and might accelerate further higher above 0.9720 resistance zone.

Important Takeaways for EUR/USD and USD/CHF

  • The Euro failed to gain pace for a move above the 1.0780 resistance zone against the US Dollar.
  • There is a major bearish trend line forming with resistance near 1.0720 on the hourly chart of EUR/USD.
  • USD/CHF gained pace and was able to clear the 0.9700 resistance zone.
  • There is a key bullish trend line forming with support near 0.9730 on the hourly chart.

EUR/USD Technical Analysis

The Euro gained pace above the 1.0700 resistance zone against the US Dollar. The EUR/USD pair climbed above the 1.0720 resistance zone to move into a bullish zone.

The pair attempted a clear move above the 1.0750 resistance, but the bears remained active. The recent high was formed near 1.0751 before the pair started a fresh decline. The price declined below the 1.0700 level and traded as low as 1.0651 on FXOpen.

EUR/USD Hourly Chart


There was a recovery wave above the 1.0680 level. It cleared the 50% Fib retracement level of the recent decline from the 1.0751 swing high to 1.0651 low.

However, the pair faced sellers near the 1.0710 level and the 50 hourly simple moving average. Besides, there is a major bearish trend line forming with resistance near 1.0720 on the hourly chart of EUR/USD. The 61.8% Fib retracement level of the recent decline from the 1.0751 swing high to 1.0651 low is also acting as a resistance.

The next major resistance is near the 1.0750 level. A clear move above the 1.0750 resistance zone could set the pace for a larger increase towards 1.0850. The next major resistance is near the 1.0920 zone.

On the downside, an immediate support is near the 1.0650 level. The next major support is near the 1.0620 level. A downside break below the 1.0620 support could start another decline.

Read Full on FXOpen Company Blog...

Offline FXOpen Trader

  • Hero Member
  • *
  • Activity: 851
  • points:
    52859
  • Karma: 0
  • Trade Count: (0)
  • Referrals: 0
  • Last Active: April 11, 2024, 12:55:29 PM
    • View Profile

  • Total Badges: 11
    Badges: (View All)
    Second year Anniversary 500 Posts One year Anniversary
Re: Daily Market Analysis By FXOpen
« Reply #193 on: June 09, 2022, 03:35:30 PM »
ETHUSD and LTCUSD Technical Analysis – 09th JUNE, 2022


ETHUSD: Double Bottom Pattern Above $1,725

Ethereum was unable to sustain its bearish momentum this week and after touching a low of 1,725 on 07th June started to correct upwards against the US dollar.

We can see a strong pullback action in the markets which is keeping the prices of Ethereum above the $1,800 handle in the European trading session today.

We can see the formation of a bullish ascending channel above the $1,800 handle, and now we are looking at $1,900 and $2,050 as the immediate targets.

The prices touched an intraday low of $1,777 in the Asian trading session, and an intraday high of $1,821 in the European trading session today.

We can clearly see a double bottom pattern above the $1,725 handle which is a bullish pattern and signifies the end of a bearish phase and the start of a bullish phase in the markets.

ETH is now trading just above its pivot level of 1,814 and moving in a strongly bullish channel. The price of ETHUSD is now testing its classic resistance level of 1,820 and Fibonacci resistance level of 1,825, after which the path towards 1,900 will get cleared.

The relative strength index is at 58 indicating a strong market and the continuation of the uptrend this week.

The StochRSI and Williams percent range are indicating an oversold level which means that the price is due to correct upwards in the short-term range.

All of the technical indicators are giving a strong buy market signal. All of the moving averages are giving a strong buy signal, and we are now looking at the levels of $1,900 to $2,000 in the short-term range.

ETH is now trading above the 100 hourly and exponential MAs.

  • A bullish reversal seen above the $1,725 mark
  • The short-term range appears to be strongly bullish
  • The parabolic SAR is indicating a bullish reversal in the hourly time frame
  • The average true range is indicating less market volatility

Ether: Bullish Reversal Seen Above $1,725


ETHUSD is moving in a strongly bullish channel with the prices trading above the $1,800 handle in the European trading session today.

We can see the formation of a bullish harami cross pattern in the 15-minute time frame indicating the potential bullish nature of the present markets.

The prices of Ethereum may continue to move upwards against the US dollar, as the medium-term investors are coming back into the markets.

The key resistance levels to watch are $1,907 and $2,077, and the price of ETHUSD needs to cross these levels for the continuation of the bullish reversal.

ETH has declined by 0.90% with a price change of 16$ in the past 24hrs and has a trading volume of 13.881 billion USD.

We can see a decrease of 37.41% in the total trading volume in the last 24 hrs which is due to the uncertain nature of the global markets.

The Week Ahead

The global investor sentiments have improved leading to a pullback action in the markets, and now we are looking at $1,900 and $2,050 as the immediate targets.

The immediate short-term outlook for Ether has turned strongly bullish, the medium-term outlook has turned NEUTRAL, and the long-term outlook for Ether is neutral in present market conditions.

This week, Ether is expected to move in a range between $1,800 and $2,000, and next week, it is expected to enter into a consolidation phase above $2,000.

Technical Indicators:

STOCH (9,6): at 65.83 indicating a BUY

The moving averages convergence divergence (12,26): at 3.66 indicating a BUY

The ultimate oscillator: at 68.27 indicating a BUY

The rate of price change: at 1.82 indicating a BUY

Read Full on FXOpen Company Blog...

Offline FXOpen Trader

  • Hero Member
  • *
  • Activity: 851
  • points:
    52859
  • Karma: 0
  • Trade Count: (0)
  • Referrals: 0
  • Last Active: April 11, 2024, 12:55:29 PM
    • View Profile

  • Total Badges: 11
    Badges: (View All)
    Second year Anniversary 500 Posts One year Anniversary
Re: Daily Market Analysis By FXOpen
« Reply #194 on: June 10, 2022, 07:31:42 AM »
Gold Price Remains At Risk and Oil Price Aims More Gains


Gold price is struggling to clear the $1,855 resistance zone. Crude oil price is rising and might continue to gain pace above the $120.00 resistance.

Important Takeaways for Gold and Oil

  • Gold price struggled above $1,860 and corrected lower against the US Dollar.
  • There was a break below a key bullish trend line with support near $1,850 on the hourly chart of gold.
  • Crude oil price gained pace after it broke the $118 and $120 resistance levels.
  • There is a major bullish trend line forming with support near $118.50 on the hourly chart of XTI/USD.

Gold Price Technical Analysis

Gold price formed a base above the $1,830 and $1,835 levels against the US Dollar. The price started a fresh increase after it broke the $1,840 resistance zone.

There was a clear move above the $1,850 level and the 50 hourly simple moving average. The price even cleared the $1,855 level and traded as high as $1,859 on FXOpen. Recently, there was a downside correction below $1,855.

Gold Price Hourly Chart


The price declined below the 50% Fib retracement level of the upward move from the $1,837 swing low to $1,859 high. There was also a break below a key bullish trend line with support near $1,850 on the hourly chart of gold.

The price also tested the 76.4% Fib retracement level of the upward move from the $1,837 swing low to $1,859 high. On the downside, an initial support is near the $1,840 level.

The next major support is near the $1,835 level, below which there is a risk of a larger decline. In the stated case, the price could decline sharply towards the $1,810 support zone. On the upside, the price is facing resistance near the $1,850 level.

The main resistance is now forming near the $1,860 level. A close above the $1,860 level could open the doors for a steady increase towards $1,875. The next major resistance sits near the $1,888 level.

Read Full on FXOpen Company Blog...


ETH & ERC20 Tokens Donations: 0x2143F7146F0AadC0F9d85ea98F23273Da0e002Ab
BNB & BEP20 Tokens Donations: 0xcbDAB774B5659cB905d4db5487F9e2057b96147F
BTC Donations: bc1qjf99wr3dz9jn9fr43q28x0r50zeyxewcq8swng
BTC Tips for Moderators: 1Pz1S3d4Aiq7QE4m3MmuoUPEvKaAYbZRoG
Powered by SMFPacks Social Login Mod