follow us on twitter . like us on facebook . follow us on instagram . subscribe to our youtube channel . announcements on telegram channel . ask urgent question ONLY . Subscribe to our reddit . Altcoins Talks Shop Shop


This is an Ad. Advertised sites are not endorsement by our Forum. They may be unsafe, untrustworthy, or illegal in your jurisdiction. Advertise Here

Show Posts

This section allows you to view all posts made by this member. Note that you can only see posts made in areas you currently have access to.


Messages - AMANPURI OFFICIAL INDONESIA

Pages: 1 2 [3] 4 5 ... 12
31
Ripple’s Competitor DRIVE Partners With Bitcoin SV (BSV) to Use Crypto As A Bridge Currency


It seems that Ripple has a new adversary since last month when DRIVE Markets was first created. The new company is set to offer services such as crypto exchanges and a payment system.

Initially, the company offered forex services for the investors but now, clients can either use DRIVE Pay or DRIVE Banking, which are services especially created for payments and transfers of money.

The new partnership with Bitcoin SV will be considerably important for the platform’s growth as the company did not have any kind of partnership like this so far.

Trying To Overcome Ripple
The CEO of DRIVE Markets, Kate Hiscox, has already affirmed that a big part of the company’s goals are to promote and improve their products, partly because they want to beat Ripple in the markets that they are trying to compete. The addition of DRIVE Banking and DRIVE Pay will be important in this regard.

With the new partnership, the company affirmed that they have finally found a reliable partner that can help in their mission. According to members of the company, they were persuaded by the new partner with their BSV adoption road map, which taught them a lot about the technology and its potential.

The current ambition of Drive Pay is to become the service that will topple Ripplenet and its services like xRapid, xVia and xCurrent. They want to “avoid the bottlenecks” which are currently faced by Ripple and offer the best possible product.

According to DRIVE Markets, the goal of DRIVE Pay is to solve problems created in cross border payments using cryptocurrencies. The company knows that the trades can be less seamless than expected, so it is focused on offering a solution for the traders interested in doing it.

Since the company already owns a crypto exchange for forex traders, the focus on cross-border transfers is obviously very strong and the company already has several clients which have a big volume of trades.

DRIVE Banking, on the other hand, will be mostly used by the banking industry and will have its own DRV token. The service will be similar to Ripple because it will also cater to banks which want to make cross-border transfers, especially within their own institutions.

Finally, DRIVE Pay was created to use the Bitcoin SV ledger in order to, in a similar fashion to XRP, make cross-border transfers. This means that banks will have their own solution for trading with other branches and people and institutions can use DRIVE Pay.

The Partnership With Bitcoin SV
Obviously, BSV will be a huge part of DRIVE Pay. Because of this, the company has to face the obvious criticism for using a token which such a controversial community.

BSV was recently delisted from Binance, the largest exchange in the world, so the company had to comment about it. According to the CEO of the company, exchanges should be neutral when it comes to the day to day activities of the communities, so they were against the delisting.

Bitcoin SV is a hard fork of the Bitcoin Cash (BCH) network and it was hard forked in November last year. The two most public faces of the token are Craig Wright and Calvin Ayre, which are deemed as very controversial figures in the industry.


source: https://bitcoinexchangeguide.com/ripples-competitor-drive-partners-with-bitcoin-sv-bsv-to-use-crypto-as-a-bridge-currency/

32
XRP - Ripple Forum / Re: What about XRP now?
« on: May 09, 2019, 04:49:11 AM »
I see it's still the same as last year, ranking between 2 and 3 side by side with ETH, if you want to invest, I think it's worth a large amount you invest

33
Cryptocurrency discussions / Re: Altcoins dumping Rate
« on: May 09, 2019, 04:46:24 AM »
I must say that i am loosing fate in altcoins. i wonder why it will took ages for these things to get a balance in the market. 90% of all the altcoins i hold plummeted right from the very first day it dropped into my wallet. None has increased in price expect CHT(counting house fund) and AEN. the rest keeps going down without any sign of increasing or stablizing. my next action on altcoins is:
any token not in first 200 coins in the coinmarket is leaving my wallet and i am serious about it.

This means that we cannot trust any coin which is not listed in coinmarket cap?

50% you also need to believe in potential new coins but we must really understand and know which coins will last or not
if you are not sure, never try a large amount

34


Blockpass To Integrate Its KYC Solution Into The Waves Platform
Waves has announced a partnership with Blockpass to bring KYC compliance to the Waves Platform. Blockpass is a firm that offers KYC and identity management solutions for clients in the blockchain industry.

KYC compliance is to ensuring safety on blockchain-driven platforms. The problem, however, is the expensiveness of KYC procedures, which makes it difficult for smaller projects to adopt. Blockpass uses blockchain technology to develop an affordable and off-the-chain solution that seamlessly integrates with clients’ software.

Sasha Ivanov, the CEO, and founder of Waves said that the company is constantly improving its platform while adding the features requested by users to simplify the development of decentralized apps. She added that KYC compliance is one of the key drivers behind the mass adoption of any blockchain project, which is why they are partnering with Blockpass.

The majority of existing KYC procedures require users to provide their personal data. Such information can potentially get in the hands of hackers. Blockpass, on the other hand, uses a unique approach that gives the user control over their data. The Blockpass mobile app allows users to create and manage a score digital identity. The identity can be used across all ecosystem that works in partnership with Blockpass.

After the successful integration of the Blockpass KYC solution into the Waves platform, every Waves user will get an airdrop containing a special PASS token. The next step will involve downloading the Blockpass mobile app and using it to create the aforementioned digital profiles. The final step will require verified users to scan the QR code on the Waves website to get listed on the platform’s whitelist.

Adam Vaziri, the CEO of Blockpass, said that it was the first time that his company is partnering an institution such as Waves. He lauded the Waves platform for embracing Web 3.0 technologies and added that secure identification procedures will improve decentralization.

source: https://bitcoinexchangeguide.com/blockpass-to-integrate-its-kyc-solution-into-the-waves-blockchain-platform/

35
The entire crypto community of traders, analysts, and investors alike are all watching Bitcoin closely, as the digital asset reaches an important inflection point in its life as a financial instrument. As traders seek to predict not only the direction of Bitcoin price, but the price target itself, oftentimes a chart will be turned upside-down to gain an unbiased and unfiltered look at support and resistance levels, as well as any patterns that may be playing out.

One particular analyst has flipped a high-timeframe Bitcoin price chart on its head, hoping to glean additional insight from it. According to the “support” levels, which are actually resistance levels, the trader says Bitcoin “is heading to at least $6,130.”

Analyst: Bitcoin Price Is Headed to $6130, Can’t Convince Me Otherwise
Bitcoin is close to putting the final nail in the bear market coffin, and is potentially entering either an accumulation phase or the beginning stages of a new bull trend. With fear and panic still felt throughout the market, crypto investors are in disbelief.

The gain more confidence, traders take to charts in order to help to determine and predict price movements. Occasionally, more advanced chartists will turn a price chart upside-down to try and remove any existing bias from the new perspective.

Related Reading | Sell in May and Go Away? A Look At Historic Bitcoin Price Performance in May

Prominent crypto analyst Josh Rager has shared such an inverse chart via Twitter, and on it clearly demonstrates powerful “support” at roughly $6,137. The trader claims that from the looks of it, Bitcoin price is headed to “at least $6,130,” and that it would be hard to convince him otherwise

https://twitter.com/Josh_Rager/status/1125474350361137152

At that level, the analyst expects Bitcoin to bounce at “support” around $6,000. He further predicts that a pullback to $4,100 – the last level of powerful resistance Bitcoin broke through to spark a massive $1,000 early April rally – is possible if Bitcoin makes a correction before moving up further.

At that level, he says “you know what to do,” suggesting that it is now time to start buying dips, further hinting that a bull run could be beginning.

Both areas on the chart posted by Rager show high volume nodes at each key price level, suggesting that this is where there is much liquidity to be tapped into for traders

Resistance at $6,000 will be difficult to break through, as Bitcoin bounced off the price level as support multiple times throughout the bear market. It wasn’t until that support broke in November 2018, when Bitcoin fell to its ultimate bear market bottom at $3,150.

Bitcoin is now valued at nearly double in price from its bear market low, causing most of the cryptoshere to consider the bear market over.

source: https://www.newsbtc.com/2019/05/08/analyst-inverse-bitcoin-price-chart-points-to-bitcoin-reaching-at-least-6130/

36


The IOTA Foundation is behind a project whose objective is to commandeer the world of Internet of Things (IoT). Even so, the coin that will power that revolutionary hyper-connected world is trading at around 30 cents, with billions in circulation and pre-mined. Regardless of price, it’s the possibilities and low competition that supporters are convinced the next bull wave would see the asset’s price spike to $55 when IOTA has control of 10 percent of the IoT space.

According to a cryptocurrency analyst, Taipei Style, IOTA has the potential to surge 18,333 percent to $55 within a tentative time frame—which maybe years upon the complete roll out of 5G internet. In a tweet, the IoT fanatic and an ardent supporter says IOTA says the progress towards domination would happen in lock steps.

https://twitter.com/change5168/status/1124538188507205632

First, with a one percent control, its market cap would increase to $15 billion in a market which he believes is worth $1.5 trillion. If the participating rate should increase to 10 percent, then IOTA’s market cap would be around $150 billion. At this point, the IOTA price would be $55, and Taipei believes it is feasible.


Note that the last cryptocurrency market Bull Run in 2017, IOTA reached at an all-time high of $5.25 with a market cap of $14.5 billion. If the cryptocurrency attains that price again, then it would account for 1 percent of the transactions on the IoT space as its market cap retest the $15 billion level. However, that is unlikely and should it happen, then there could be a complete shift with IOTA consensus algorithm first of all functioning as designed and coordicide implementation flawless.

His sentiment comes a few days after another supporter argued that all IoT firms planning to be relevant should begin accumulating IOTA coins. The IOTA bull cites ground breaking tech and a multibillion dollar market that companies are beginning to explore. Although critics argue that IOTA platform is not simply a network and not designed to harvest true value in data like what competing centralized companies—like Amazon Web Services, Google and Microsoft are testing and improving on; the vast market is what would pique investor interest.

It is projected that by 2020, more than 30 billion devices will be connected to the internet of things and the sheer amount of data willing customers will be ready to share could be overwhelming. According to a report by Forbes, the IoT market will likely expand to $521 billion in 2021 with a CAGR of more than 50 percent spurred by increasing connection and optimism by enterprises.

Despite supporter’s projection, IOTA is eons from the $55 mark. As we have stated above, the network’s consensus algorithm would have to function flawlessly, without criticism and centralization.

https://twitter.com/tangleblog/status/1123268460417560576

Then again, IOTA must have strong partners within the manufacturing space as they roll out products with IOTA as facilitators. It’s only when there is complete trust that IOTA could expand to above $55.

source: https://ethereumworldnews.com/iota-rallying-by-18300-percent-to-55-is-possible-ardent-bull-confident/

37


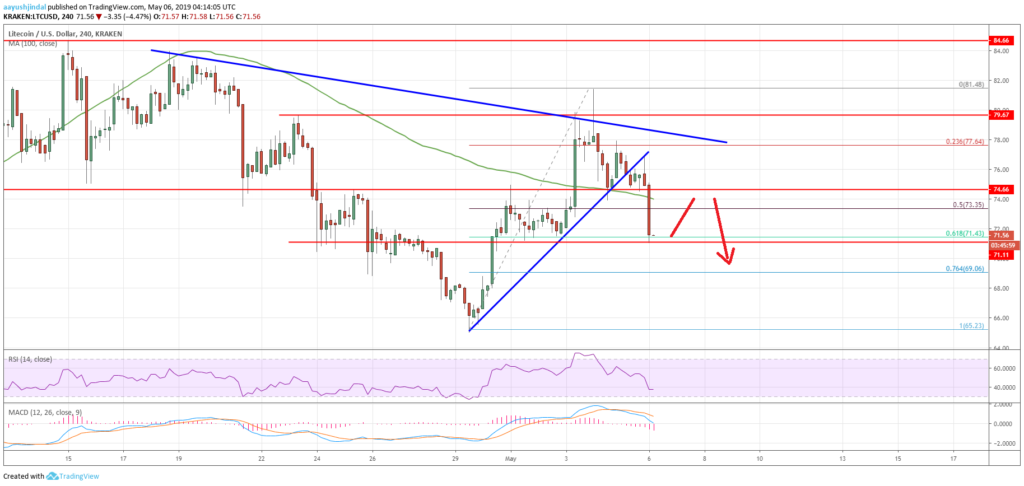
Litecoin price failed to gain strength above the $80.00 resistance against the US Dollar. LTC started a fresh decline and it could even break the $70.00 support in the near term

- Litecoin price failed to break the $80.00 barrier and declined recently (Data feed of Kraken) against the US Dollar.
- There is a major bearish trend line formed with resistance near the $77.60 level on the 4-hour chart.
- LTC price recently declined below the $74.80 support and a connecting bullish trend line.

Litecoin Price Analysis (LTC)
This past week, there were strong gains in bitcoin, but most altcoins such as Ethereum, EOS, ripple, litecoin and others struggled against the US dollar. The LTC/USD pair faced a strong selling interest near the $80.00 resistance and recently started a downward move.


Looking at the 4-hour chart, LTC price topped near the $81.50 level and later declined sharply. There was a break below the $78.00 and $76.00 support levels to push the price back in a bearish zone.

During the decline, the price traded below the $74.80 support and a connecting bullish trend line. Moreover, there was a close below the $75.40 support and the 100 simple moving average (4-hour).

Besides, there was a clear break below the 50% Fib retracement level of the last wave from the $65.23 low to $81.48 high. The price declined below $72.50 and recently tested the $71.20 support area.

It seems like the 61.8% Fib retracement level of the last wave from the $65.23 low to $81.48 high is currently acting as a support. If there is a downside break below $71.20, there is a risk of more losses below the $70.00 support level.

The next key support is near the $68.00 level, where the bulls may appear. On the upside, there is a major bearish trend line formed with resistance near the $77.60 level on the same chart. To start a fresh increase litecoin price must break the $74.80 and $77.60 levels. As long as LTC is below $74.80, there is a risk of more losses below $70.00.

source: https://ethereumworldnews.com/litecoin-ltc-price-analysis-risk-of-downside-extension-below-70/

38
every patience will surely bear fruit from patience itself. I hope the negative news about Bitcoin and others will not happen again so that investors are not faced with doubts about the existing coins

39
Untuk sementara waktu, Bitcoin tampaknya berada di ambang pelarian bull. Ini telah membuat banyak investor bersemangat untuk melihat yang terjadi saat ini, tetapi beberapa orang memiliki harapan yang berbeda.

MagicPoopCannon adalah seorang analis Twitter tentang segala sesuatu yang berhubungan dengan crypto dan telah memberikan pemikirannya kepada para pengikutnya untuk saat ini.

Menurutnya, Bitcoin tidak ke mana-mana! Ini mungkin sulit didengar oleh banyak dari Anda (termasuk kami) tetapi ini hanya satu pemikiran analis.

Sebelum kita melangkah lebih jauh, ada baiknya mengatakan bahwa kita bukan investor keuangan dan ini bukan nasihat keuangan. Silakan lakukan riset Anda sendiri sebelum memasukkan uang Anda ke dalam cryptocurrency dan selalu ingat untuk melakukan trading dengan aman


untuk membaca  artikle asli  di : https://kabarcoin.com/bull-run-bitcoin-tidak-akan-terjadi/

40
Anonymous Crypto Whale Sees the Price of Bitcoin (BTC/USD) at $50,000 Mark in Next 3-5 Years


According to a mysterious cryptocurrency whale that owns more than 7,000 Bitcoin (BTC), the digital currency could surpass $50,000 in the future. He said that during a conversation with CCN a few hours ago.

Cryptocurrency Large Investor Sees Bitcoin Above $50k
After a very negative 2018 for Bitcoin’s price, the digital asset seems to be moving up once again. This time, the digital currency has surpassed $5,800 and was close to $6,000 a very important psychological price level. The same investor says that Bitcoin is now going to eclipse the $50,000 mark. He bases his prediction on some seasoned technical analysis.


The investor explained that he enter the Bitcoin and crypto markets in the early days of the cryptocurrency. He has also invested in Binance and Ethereum (ETH), among others.

On the matter, he commented:

“I actively invested in Bitcoin back in those years when only in small circles knew about it. Before investing, I conducted a personal analysis of Bitcoin technology. I saw a great prospect for society in him and the financial system as a whole, which had already begun to change.”

He went on saying that we are still in the early days of Bitcoin and the cryptocurrency ecosystem and things can change in the future. Thus, he sees a huge potential in the cryptocurrency market. He expects Bitcoin to reach and surpass $50,000 in the next three to five years. While there are many bitcoin price predictions to thumb through, most should be taken with a grain of salt and should never be taken as investment advice. However, as time goes by day by day, there are more believers in bitcoin than there were yesterday and that is since remained true since its decade-ago inception.

Although Bitcoin started to grow a few days ago, he is not fully convinced that we entered a bull market, even when we could see virtual currencies entering a positive trend in the near future.


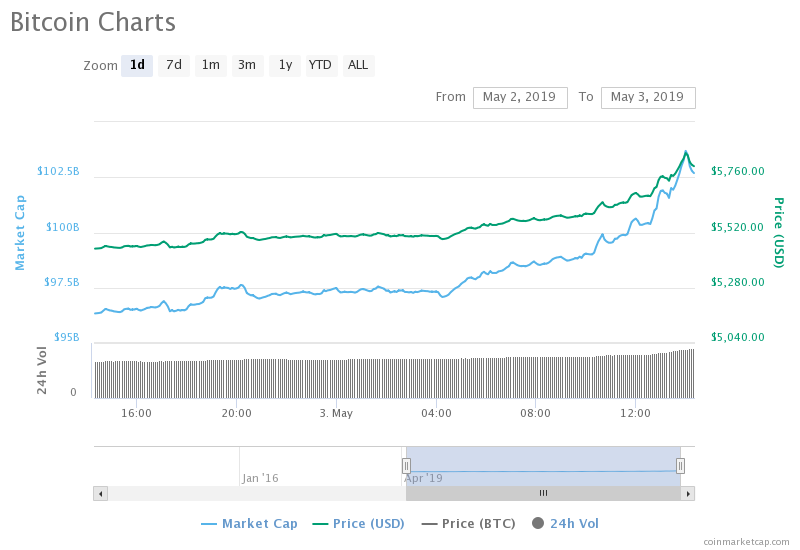
Bitcoin’s price is $5,734.20 BTC/USD exchange rate today. The real-time BTC market cap of $101.4 Billion currently ranks #1 with a chart dominance at 55.78%, daily trading volume of $4.75 Billion and live coin value change of BTC 2.48% in the last 24 hours.


source:https://bitcoinexchangeguide.com/anonymous-crypto-whale-sees-the-price-of-bitcoin-btc-usd-at-50000-mark-in-next-3-5-years/

41
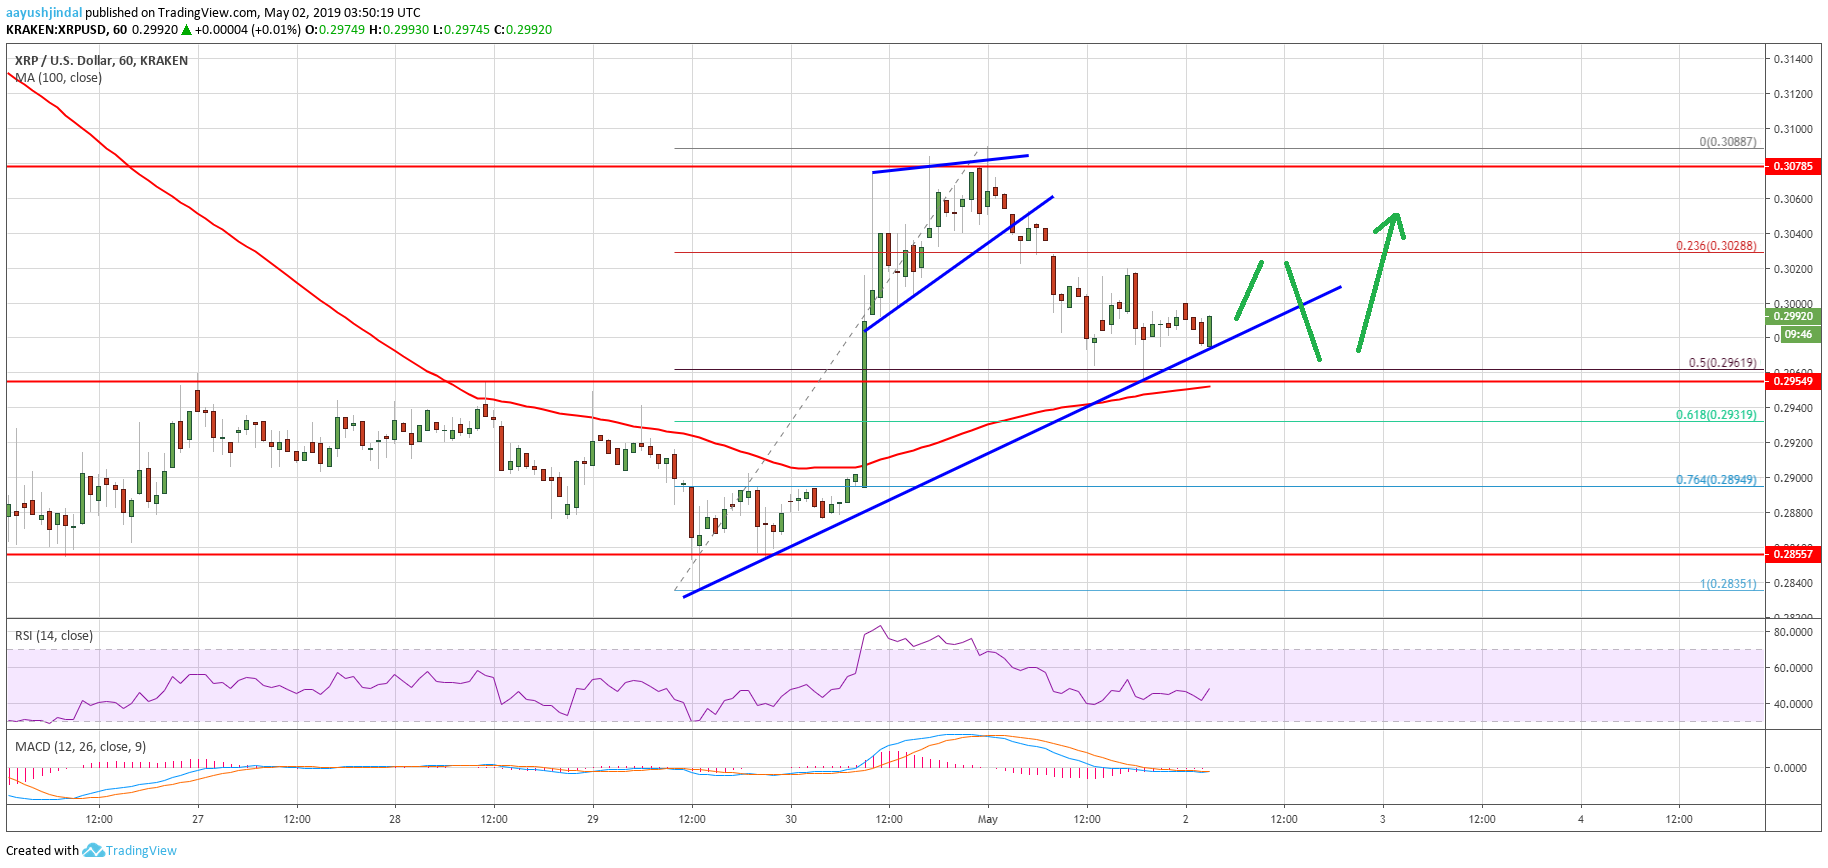
Ripple price is currently trading in a range against the US Dollar, but lost ground vs bitcoin. XRP might start a strong upward move if it clears $0.3020 and $0.3040.

Ripple Price Analysis
In the past two days, there was a steady decline in ripple price from the $0.3089 swing high against the US Dollar. The XRP/USD pair broke the $0.3040 and $0.3000 support levels. It even broke the $0.2980 level and tested the next key support near $0.2950, where buyers emerged. The 50% Fib retracement level of the upward move from the $0.2834 low to $0.3089 high also acted as a support. As a result, there were a couple of swing moves and the price remained above the $0.2950 support.

On the upside, an initial resistance is near $0.2985, and the 23.6% Fib retracement level of the recent decline from the $0.3089 high to $0.2951 low. However, the main resistance is near the $0.3000 and $0.3010 levels. There is also a declining channel in place with resistance near $0.3010 on the hourly chart of the XRP/USD pair. Above the channel resistance, the $0.3020 level could prevent gains. It represents the 50% Fib retracement level of the recent decline from the $0.3089 high to $0.2951 low.

If there is a successful close above $0.3000 and $0.3020, the price could start a strong upward move. The next resistance is near $0.3040, above which the price may revisit the $0.3089 swing high. On the downside, the $0.2950 support holds the key. If there is a bearish break below $0.2950, the price may perhaps decline sharply towards $0.2900 or $0.2880.


Looking at the chart, ripple price is likely to grind higher considering the current market sentiment for bitcoin. A few other altcoins are gaining momentum, therefore, XRP price might also start a decent upward move. Having said that, the bulls need to pierce the $0.3020 resistance with a follow through above $0.3040 to challenge the $0.3100 or $0.3120 level.

Technical Indicators
Hourly MACD – The MACD for XRP/USD is slowly moving in the bullish zone.

Hourly RSI (Relative Strength Index) – The RSI for XRP/USD is still below the 50 level, with a minor bearish angle.

Major Support Levels – $0.2960, $0.2950 and $0.2910.

Major Resistance Levels – $0.3000, $0.3020 and $0.3040.

source: https://www.newsbtc.com/2019/05/03/ripple-xrp-price-bounce-to-0-3100/

42
The bitcoin price on Friday jumped 7.48 percent to establish a fresh five-month high towards $5,864. The uptrend further pulled altcoins out of their bias conflict scenarios.

Ethereum, for instance, printed 4.5 percent gains against the dollar in the last 24 hours. Similarly, XRP, EOS, Bitcoin Cash, Litecoin, and others also trended in positive territory after a week of sideways action.


Nevertheless, the top altcoins underperformed against bitcoin. The last 24 hours saw Ethereum dropping 1.85 percent of its value against the king cryptocurrency. Similarly, Ripple’s XRP plunged 3.76 percent, Stellar dived a whopping 5.23 percent, and Cardano and Tron fell close to 3.5 percent each against bitcoin. Only Dash and Binance Coin managed to hold their gains.

The move helped bitcoin strengthen its dominance in the cryptocurrency market. Against a 33.41 percent control recorded on January 8 last year, the bitcoin market today covered more than 55 percent of the total cryptocurrency market. The statistics showed that more traders were flocking towards bitcoin during interim bullish sessions.

source: https://www.newsbtc.com/2019/05/03/bitcoin-dominance-soars-above-55-after-meteoric-rise-to-2019-high/

43
Ripple price is trading with a positive bias above key supports against the US Dollar, but struggling vs bitcoin. XRP could bounce back as long as it is holding the $0.2950 support.

Ripple Price Analysis
Yesterday, we saw a nice upward move in ripple price above the $0.2950 and $0.3000 resistances against the US Dollar. The XRP/USD pair gained traction and broke the $0.3050 level as well and settled above the 100 hourly simple moving average. It traded close to the $0.3090 level and formed a new swing high near $0.3088. Later, it started a downside correction and traded below the $0.3050 support. There was a break below the 23.6% Fib retracement level of the last wave from the $0.2835 low to $0.3088 high.

The price even cleared the $0.3000 support level and tested the main $0.2950 support level. Besides, the 50% Fib retracement level of the last wave from the $0.2835 low to $0.3088 high prevented losses. The price is currently moving higher and trading well above $0.2950. There is also a key bullish trend line in place with support near $0.2965 on the hourly chart of the XRP/USD pair. The pair seems to be well supported near $0.2960 and $0.2950. Besides, the 100 hourly SMA is also positioned near the $0.2950 support area.

On the upside, an initial resistance is near the $0.3000 level, above which the price may test $0.3020. However, a successful close above $0.3050 will most likely set the pace for more gains above the $0.3100 resistance level. The next key resistances are near $0.3120 and $0.3125


Looking at the chart, ripple price is clearing trading above the key $0.2960 and $0.2950 support levels. If there is a downside break below the $0.2950 support and the 100 hourly SMA, the price could move into a bearish zone. An immediate support is near the $0.2910 level, below which the price may revisit the $0.2850 support level in the near term.

Technical Indicators
Hourly MACD – The MACD for XRP/USD is slowly moving in the bearish zone.

Hourly RSI (Relative Strength Index) – The RSI for XRP/USD is currently below the 50 level, but it is holding the 40 level.

Major Support Levels – $0.2960, $0.2950 and $0.2910.

Major Resistance Levels – $0.3020, $0.3050 and $0.308


source: https://www.newsbtc.com/2019/05/02/ripple-xrp-price-holding-key-support/

44
The bitcoin market’s bullish bias is looking stronger than other altcoins, according to Josh Rager.

The cryptocurrency analyst said Wednesday that bitcoin was among the only crypto assets that managed to jump above a significant resistance level on monthly charts. In contrast, other top crypto assets including Litecoin, Ethereum, and EOS failed to close above a similar level in their respective markets, as shown below.


Historical Significance
Rager considered $4769.03 as a significant resistance level for bitcoin. The horizontal plane had capped an active upside attempt during the September 2017 trading session. As the price broke above that level, it ended up establishing its historical peak towards circa $20,000.

The April trading session saw the coin breaching above $4,769. The move led Rager to make a medium-term bull bias case for bitcoin, stating that if bitcoin stays above $4,769, then its probability of hitting a fresh 2019 high above $6,000 will be higher.

“I would love to long/buy on a Bitcoin pullback at $4,339-4,769 zone. [The price] has room to push up over $6,383 on 1M Chart so no promises on a pullback at this moment.”

As for other altcoins, their April price action mirrored the moves made by bitcoin in the recent months. But almost all of them were looking at their uptrends undergoing a fresh downside correction.

https://twitter.com/Josh_Rager/status/1123544972702175232

Litecoin, for instance, briefly underwent a pullback after jumping above $74.80, its resistance from September 2017. Ethereum performed a similar stunt after correcting lower ahead of testing its $200-resistance. EOS too dropped lower amidst high selling sentiment near $5.921.

“BTC looks stronger and closed above resistance while other alt majors hit resistance & pulled back,” Rager stated. “Once we hit between $6300 to $6400 would be a time to short. So, I still think it could push up than pull back in May early June.”

Bitcoin Weaker in 2019
Rager’s prediction is more favorable towards bitcoin despite the cryptocurrency’s weaker buying sentiment against the top altcoins this year. Every since it established a low towards $3,100, the BTC/USD pair has recovered by 72 percent. The attractive rebound nevertheless is dwarfed by the rebounds in other coin markets.

Bitcoin’s forked version Bitcoin Cash, for instance, jumped 284 percent upon hitting a low towards $73.54 last December. Similarly, the litecoin price ballooned 228 percent, rising from its cycle low of $22.43 to $72.67, its rate at the press time. EOS also rebounded by more than 200 percent in just four months, while Ethereum, at a decent 95 percent recovery, also remained ahead of bitcoin.

But the fact that most of those altcoins are pulling back while, at the same time, bitcoin is holding on to its April profits, indicates that traders are moving back to the bitcoin market.

source: https://www.newsbtc.com/2019/05/02/analyst-bitcoin-has-stronger-bullish-potential-than-altcoins-heres-why/

45
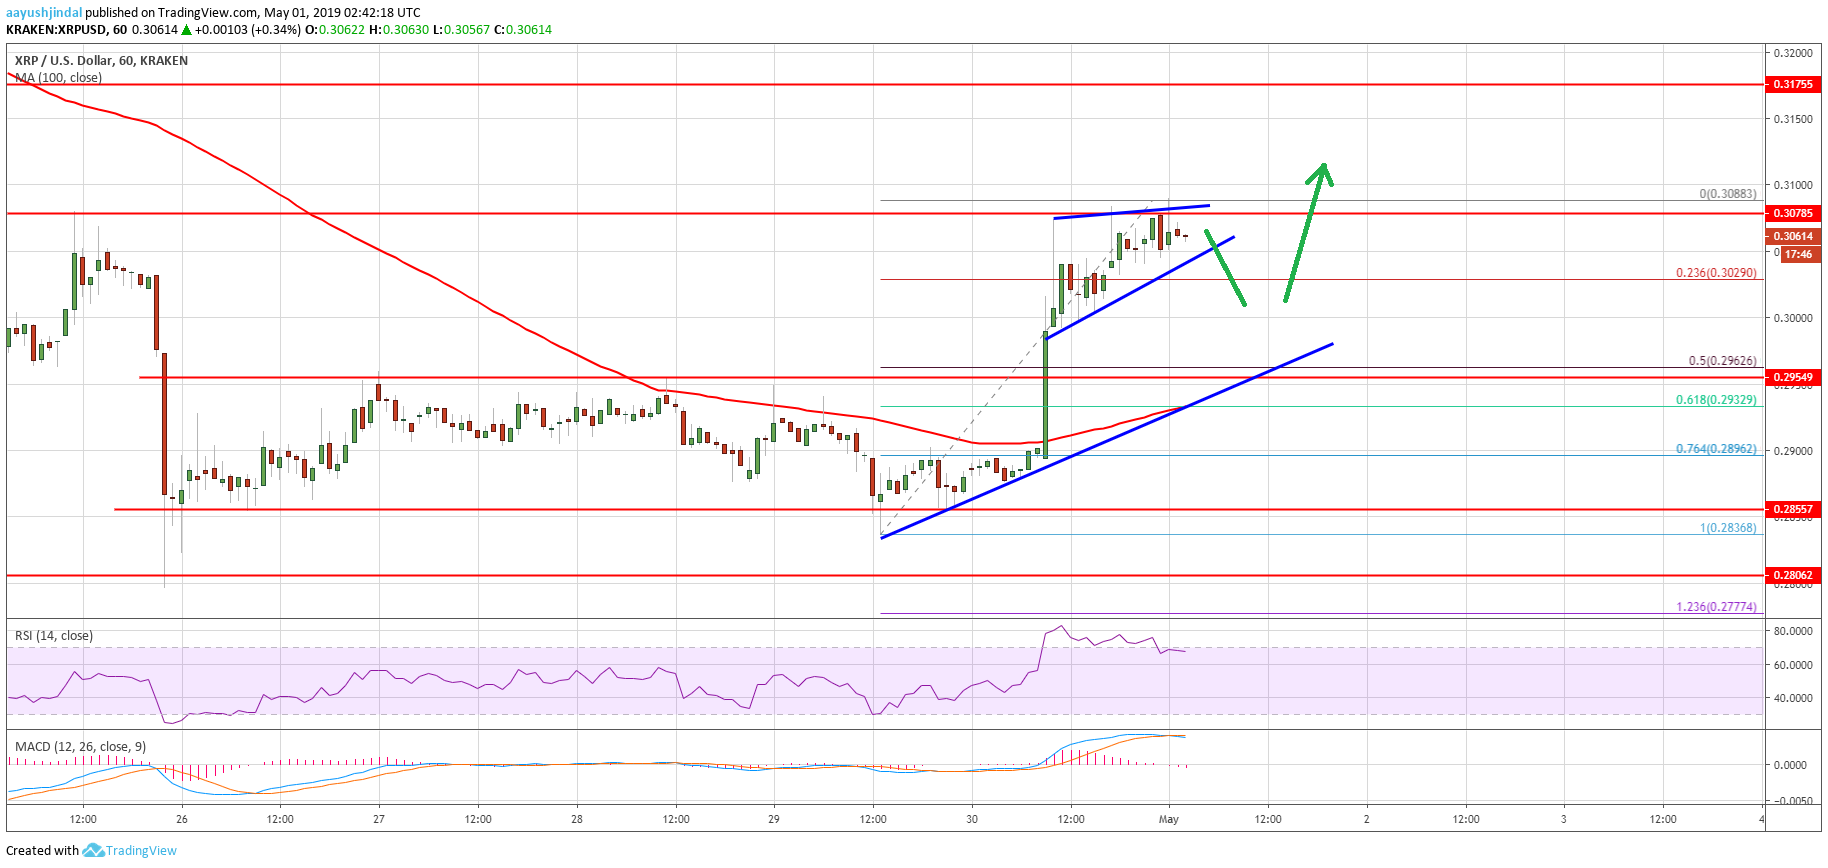
Ripple price starts a decent rebound against the US Dollar, along with bitcoin. XRP is currently trading with a positive bias and looks set to test the $0.3200 barrier.

Ripple Price Analysis
After a major drop, ripple price formed a strong support above the $0.2850 level against the US Dollar. The XRP/USD pair slowly climbed above the $0.2880 and $0.2900 resistance levels. Later, there was a close above the $0.2920 resistance level and the 100 hourly simple moving average. Besides, the price cleared the 61.8% Fib retracement level of the drop from the $0.3082 high to $0.2798 low. It opened the doors for more gains and the price spiked above the $0.3080 level.

A high was formed near the $0.3088 level and the price is currently consolidating gains. Furthermore, there is a short term breakout pattern forming with resistance near $0.3085 on the hourly chart of the XRP/USD pair. Below the triangle support, the 23.6% Fib retracement level of the recent wave from the $0.2836 low to $0.3088 high might act as a support. The next key support is near the $0.2960 level. The 50% Fib retracement level of the recent wave from the $0.2836 low to $0.3088 high is also near the $0.2960 level.

On the upside, a break above the $0.3085 and $0.3100 levels is likely to open the doors for more gains. The next key resistance is near the $0.3160 and $0.3175 levels. Above these, the price is likely to grind further higher towards the $0.3200 resistance level.


Looking at the chart, ripple price clearly climbed higher and it is currently consolidating gains above $0.3000. In the short term, there could be a downside correction towards $0.3000 or $0.2960. There is also a connecting bullish trend line in place with support near the $0.2960 level on the same chart. Therefore, dips remain well supported close to the $0.2960 level. To the topside, the main target for the bulls could be $0.3200 or even the $0.3220 pivot level.

source:https://www.newsbtc.com/2019/05/01/ripple-xrp-price-appreciation-btc-eth-jumps/

Pages: 1 2 [3] 4 5 ... 12
ETH & ERC20 Tokens Donations: 0x2143F7146F0AadC0F9d85ea98F23273Da0e002Ab
BNB & BEP20 Tokens Donations: 0xcbDAB774B5659cB905d4db5487F9e2057b96147F
BTC Donations: bc1qjf99wr3dz9jn9fr43q28x0r50zeyxewcq8swng
BTC Tips for Moderators: 1Pz1S3d4Aiq7QE4m3MmuoUPEvKaAYbZRoG
Powered by SMFPacks Social Login Mod