Latest news:


 Shop
Shop
 Bidding Open
826
Advertise Your Stuff / Re: Daily Market Analysis By FXOpen
« on: November 09, 2021, 04:32:15 PM »
BTCUSD and XRPUSD Technical Analysis – 09th NOV, 2021

BTCUSD: Bullish Ascending Channel Above $65,000
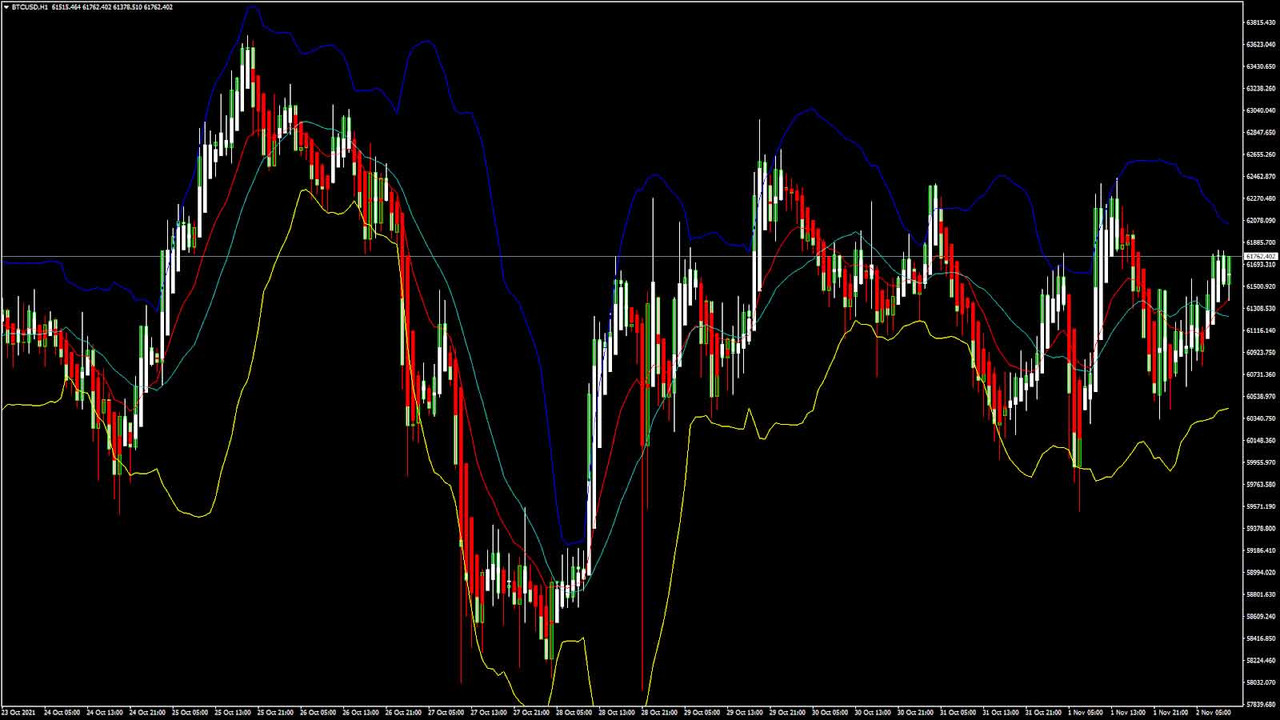
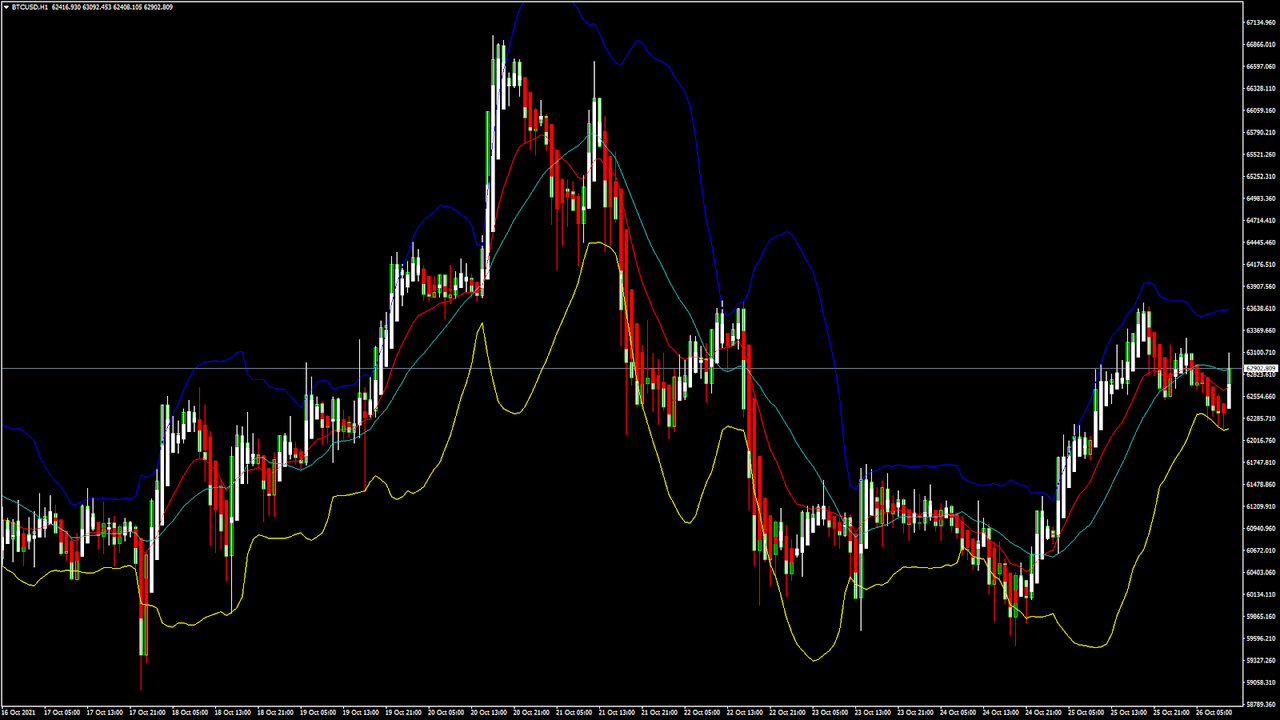
Bitcoin is moving in a strong bullish ascending channel above the $65,000 handle, and the continuous demand is pushing the prices of BTCUSD higher today in the European trading session. Bitcoin has already crossed its previous all-time high of $67,700 and is now trading above it.
This bitcoin rally is a result of continuous buying pressure and demand for BTC ETFs. The current trend is expected to continue with the immediate targets of $70,000 this week.
We have seen a moving averages crossover for the 5 hourly MA signifying that in the short-term, a downward correction in the levels of bitcoin is expected.
StochRSI is indicating OVERBOUGHT levels signifying that the markets can enter into a consolidation or price recovery phase at any time. Those who are looking to buy at current market levels will have to wait for the downward correction of prices to get an attractive entry for long-term holdings.
Bitcoin is now moving above its both 100 hourly simple and exponential moving averages.
Medium to long term outlook remains bullish for BTCUSD with targets of $70,000 before the end of this month.
Bitcoin is slowly consolidating its gains without any significant drop in its levels today.
Bitcoin Rally Towards $70,000 Confirmed

BTCUSD has already crossed its major resistance level of $64,129 and continues to trade above the important psychological support level of $65,000.
The price of BTCUSD is now facing its Fibonacci resistance level of $67,844 and Camarilla resistance level of $67,914, after which the path towards $70,000 will get cleared.
In the last 24hrs, BTCUSD has gone UP by +3.36% with the price change of +2215$ and has a 24hr trading volume of USD 40.583 billion.
Bitcoin Touches Record Highs on Inflation Fears
Since last week, Bitcoin has witnessed heavy inflow of cash investments with a total value of $95 million USD on US inflation fears. Leading investment firm JPMorgan has already revised its upwards projection for the BTC stating that bitcoin is going to cross $146,000 in the year 2022, and hit the level of $73,000 before the end of 2021.
Next week, bitcoin is also expected to roll out its biggest software update known as Taproot, which will enable increased transaction efficiency and privacy for its users.
Since last week, this news has led to an increase in the total market capitalization of bitcoin by $120 billion USD.
The Week Ahead
If the price of bitcoin continues to hold above the $65,000 handle, we can witness another rally in the markets next week which will eventually push the prices of BTCUSD towards $70,000.
A short-term correction is also expected, pushing the BTCUSD down below the $65,000 mark and also giving more opportunities to fresh buyers in the market. Since the dips in bitcoin remain well supported, there is no possibility of a trend reversal, and the uptrend is expected to continue in the next week.
This week, BTCUSD is expected to cross the $68,000 line and aim for upsides of $69,000 to $69,500 the next week. Both the medium term and long term outlooks remain positive, and next week, we could witness BTC printing at above the $68,000 mark.
Technical Indicators:
Relative strength index (14-day): at 70.04 indicating a BUY
Rate of price change: at 2.835 indicating a BUY
Moving averages convergence divergence (12,26): at 990.80 indicating a BUY
Ultimate oscillator: at 66.44 indicating a BUY
Read Full on FXOpen Company Blog...
BTCUSD: Bullish Ascending Channel Above $65,000
Bitcoin is moving in a strong bullish ascending channel above the $65,000 handle, and the continuous demand is pushing the prices of BTCUSD higher today in the European trading session. Bitcoin has already crossed its previous all-time high of $67,700 and is now trading above it.
This bitcoin rally is a result of continuous buying pressure and demand for BTC ETFs. The current trend is expected to continue with the immediate targets of $70,000 this week.
We have seen a moving averages crossover for the 5 hourly MA signifying that in the short-term, a downward correction in the levels of bitcoin is expected.
StochRSI is indicating OVERBOUGHT levels signifying that the markets can enter into a consolidation or price recovery phase at any time. Those who are looking to buy at current market levels will have to wait for the downward correction of prices to get an attractive entry for long-term holdings.
Bitcoin is now moving above its both 100 hourly simple and exponential moving averages.
Medium to long term outlook remains bullish for BTCUSD with targets of $70,000 before the end of this month.
Bitcoin is slowly consolidating its gains without any significant drop in its levels today.
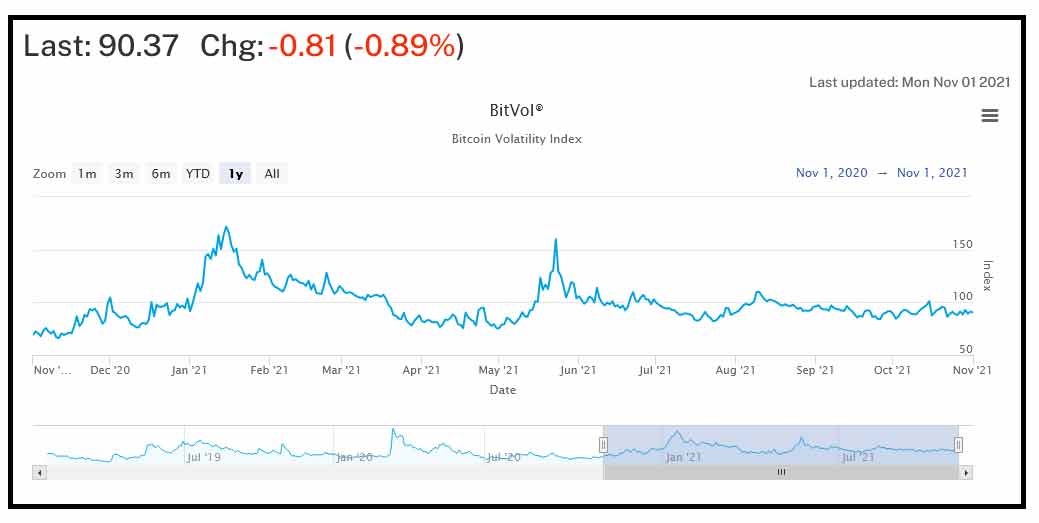
- Average true range indicates less market volatility
- Williams percent range is indicating an OVERBOUGHT level
- The price is now trading just below its pivot level of $67,989
- All the moving averages are giving a STRONG BUY signal at the current market level of $67,860
Bitcoin Rally Towards $70,000 Confirmed
BTCUSD has already crossed its major resistance level of $64,129 and continues to trade above the important psychological support level of $65,000.
The price of BTCUSD is now facing its Fibonacci resistance level of $67,844 and Camarilla resistance level of $67,914, after which the path towards $70,000 will get cleared.
In the last 24hrs, BTCUSD has gone UP by +3.36% with the price change of +2215$ and has a 24hr trading volume of USD 40.583 billion.
Bitcoin Touches Record Highs on Inflation Fears
Since last week, Bitcoin has witnessed heavy inflow of cash investments with a total value of $95 million USD on US inflation fears. Leading investment firm JPMorgan has already revised its upwards projection for the BTC stating that bitcoin is going to cross $146,000 in the year 2022, and hit the level of $73,000 before the end of 2021.
Next week, bitcoin is also expected to roll out its biggest software update known as Taproot, which will enable increased transaction efficiency and privacy for its users.
Since last week, this news has led to an increase in the total market capitalization of bitcoin by $120 billion USD.
The Week Ahead
If the price of bitcoin continues to hold above the $65,000 handle, we can witness another rally in the markets next week which will eventually push the prices of BTCUSD towards $70,000.
A short-term correction is also expected, pushing the BTCUSD down below the $65,000 mark and also giving more opportunities to fresh buyers in the market. Since the dips in bitcoin remain well supported, there is no possibility of a trend reversal, and the uptrend is expected to continue in the next week.
This week, BTCUSD is expected to cross the $68,000 line and aim for upsides of $69,000 to $69,500 the next week. Both the medium term and long term outlooks remain positive, and next week, we could witness BTC printing at above the $68,000 mark.
Technical Indicators:
Relative strength index (14-day): at 70.04 indicating a BUY
Rate of price change: at 2.835 indicating a BUY
Moving averages convergence divergence (12,26): at 990.80 indicating a BUY
Ultimate oscillator: at 66.44 indicating a BUY
Read Full on FXOpen Company Blog...