- Ripple price failed to hold gains above the $0.3120 and $0.3100 supports against the US dollar.
- The price tested the $0.3060 support and it is currently trading near the $0.3100 pivot level.
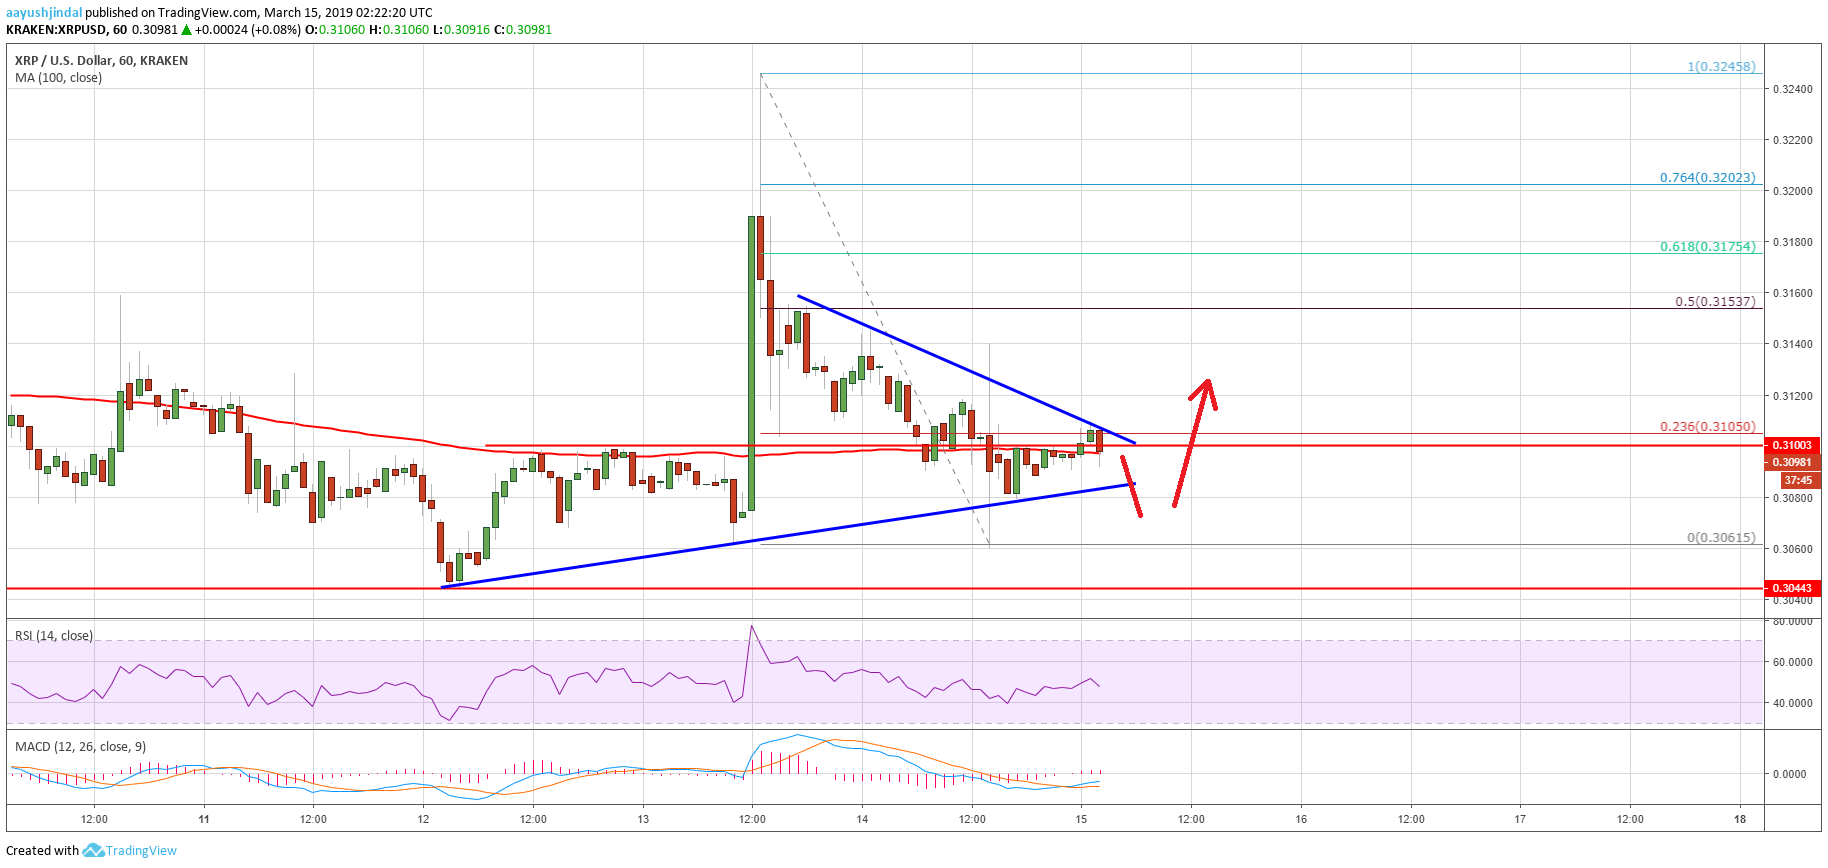
- There is a key contracting triangle in place with resistance at $0.3110 on the hourly chart of the XRP/USD pair (data source from Kraken).
- The pair could either dip sharply below $0.3060 or it may rise above the $0.3110 and $0.3120 resistances.
Ripple price trimmed its recent gains and declined against the US Dollar and bitcoin. XRP/USD might accelerate losses if it fails to break the $0.3120 resistance level in the near term.
Ripple Price AnalysisYesterday, we saw a nice upward move in ripple price above the $0.3150 and $0.3200 resistances against the US Dollar. The XRP/USD pair even tested the $0.3250 level, but it failed to hold gains. As a result, there was a sharp decline below the $0.3200 and $0.3150 levels. The price even spiked below the $0.3120 support and the 100 hourly simple moving average. A swing low was formed at $0.3060 before the price corrected higher during BTC and Ethereum recovery.
The price moved above the $0.3080 level and tested the 23.6% Fib retracement level of the recent drop from the $0.3245 high to $0.3061 low. However, the price seems to be facing a strong resistance near the $0.3105 level and the 100 hourly SMA. Besides, there is a key contracting triangle in place with resistance at $0.3110 on the hourly chart of the XRP/USD pair. If the pair manages to climb above the $0.3110 and $0.3120 resistance levels, there could be a decent recovery.
The next resistance is near the $0.3150 level. It represents the 50% Fib retracement level of the recent drop from the $0.3245 high to $0.3061 low. On the other hand, if the price fails to move above the $0.3110 resistance, there may be a sharp dip. The $0.3060 support is crucial, below which the price might decline heavily. The next key supports are near $0.3040 and $0.3015.
Looking at the chart, ripple price is currently trading near a crucial juncture below the $0.3110 resistance. If buyers fail to gain strength, the price might start a nasty decline below $0.3060. In the short term, there could be range moves before the price either climbs above $0.3120 or revisits the $0.3060 support level.
Technical IndicatorsHourly MACD – The MACD for XRP/USD is slowly moving back into the bullish zone.
Hourly RSI (Relative Strength Index) – The RSI for XRP/USD is struggling to stay above the 50 level and moving lower with a bearish angle.
Major Support Levels – $0.3060, $0.3040 and $0.3015.
Major Resistance Levels – $0.3110, $0.3120 and $0.3150.
source :
https://www.newsbtc.com/2019/03/15/ripple-price-analysis-xrp-could-trade-lower-as-recovery-falls-flat/

 .
.  .
.  .
.  .
.  .
.  .
.  Shop
Shop

 Topic: Ripple Price Analysis: XRP Could Trade Lower As Recovery Falls Flat (Read 1600 times)


 Latest news: