Since Ethereum has been surging over the last few hours, let’s go ahead and check out its price action to see what may be next for investors.
Ethereum Price Analysis
The first thing that we can observe on the price chart for Ethereum on the daily resolution is that the EMA-200 (purple line) is looming directly overhead to serve as a resistance for further price action.
This is something that traders should definitely note.
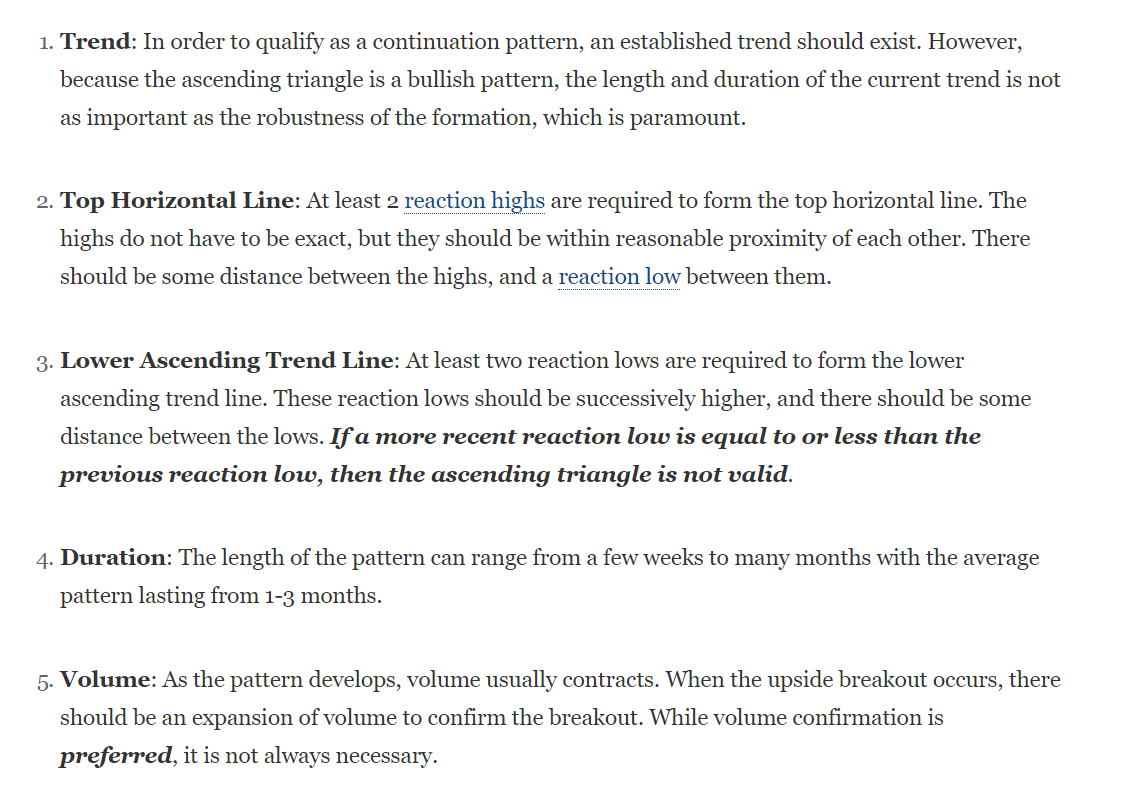
Potential Ascending Triangle FormationMany (including the author) have noticed what appears to be the makings of an ascending triangle (flat-top triangle). These are bullish continuation/reversal patterns that often lead to major gains.
In fact, it is the fulfillment of this pattern that led to Bitcoin’s massive gains.
Let’s briefly review below what an ascending triangle (flat-top) pattern formation looks like and how it works:
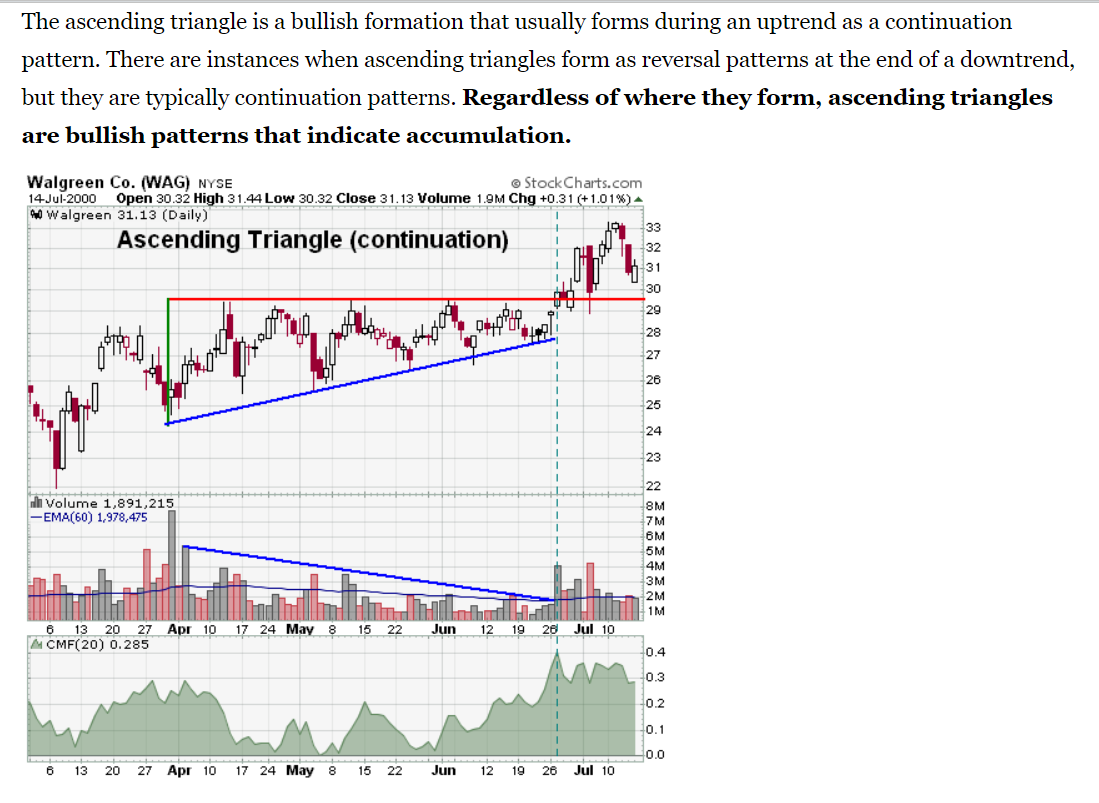
Let’s see how Ethereum matches up with this chart formation on the daily resolution:

From what we can see above, the current price action for Ethereum does have all of the trappings of a flat-top triangle.
Let’s go to the current price action (down to the candle) to see if the current day’s price action reflects a true breakout:

At first glance, it does. However, what is seen above should not be considered to be a true breakout.
Why?
When Volume Does Not Match Breakout, it is a ‘False Breakout’
source:
https://bitcoinexchangeguide.com/ethereum-price-analysis-latest-forecast-shows-false-eth-breakout/

 .
.  .
.  .
.  .
.  .
.  .
.  Shop
Shop

 Topic: Ethereum Price Analysis: Latest Forecast Shows False ETH Breakout (Read 1720 times)


 Latest news: