
- On the upside, a bullish break will hit the $8.0 resistance level and the price will rally above the $10 price level.
- Since the price was fluctuating between the upper and lower price level; it is most likely to revisit the lower price level.
ETC/USD Long-term Trend: Ranging - Resistance levels: $8, $8.5, $9
- Support levels: $7.0, $6.5, $6.
Since on April 7, the ETC/USD pair had been facing resistance at the $8 price level. The crypto’s price was trading between the levels of $5.50 and $8.0. In April, the market fell to the support of the $5.41 price level and commenced a sideways trend. The 12-day EMA and the 26-day EMA were trending horizontally indicating that price was in a sideways trend. On May 16, the bulls tested the $8 resistance level and were resisted. Since the price was fluctuating between the upper and lower price level; it is most likely to revisit the lower price level.
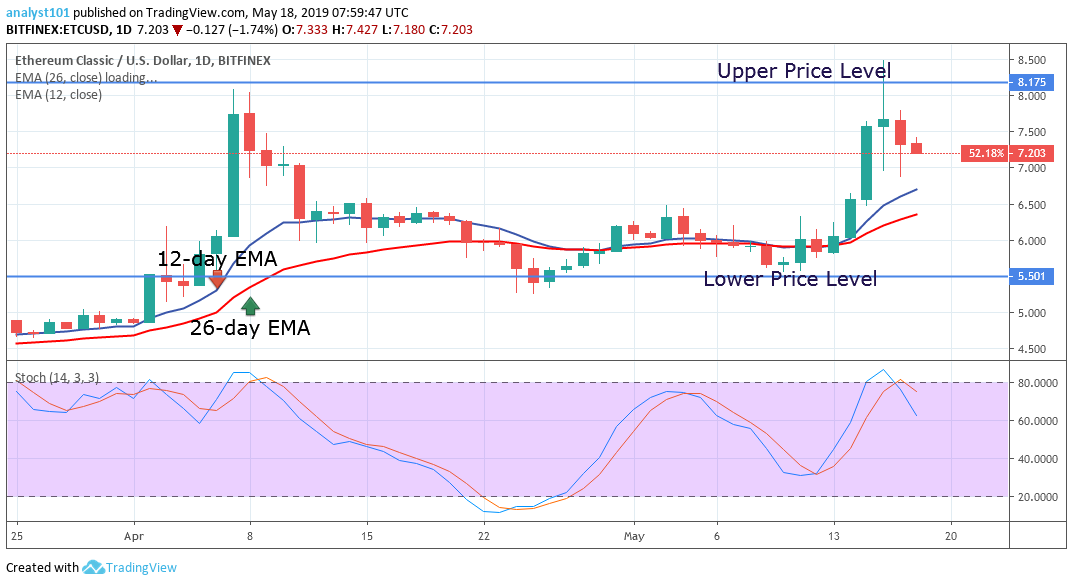
On the upside, a bullish break will hit the $8.0 resistance level and the price will rally above the $10 price level. The stochastic is at the overbought region but below the 80% range which indicates that the ETC price is in a bearish momentum and a sell signal.
source:
https://bitcoinexchangeguide.com/ethereum-classic-price-prediction-long-term-etc-value-forecast-may-18/

 .
.  .
.  .
.  .
.  .
.  .
.  Shop
Shop

 Topic: Ethereum Classic Price Prediction: Long-term (ETC) Value Forecast – May 18 (Read 6602 times)


 Latest news: