The Bitcoin (BTC) price made another all-time high breakout attempt on Dec. 23 but was rejected and has been decreasing since.
However, technical indicators are not all that bearish. Bitcoin is expected to reverse its trend at one of the support levels examined below.
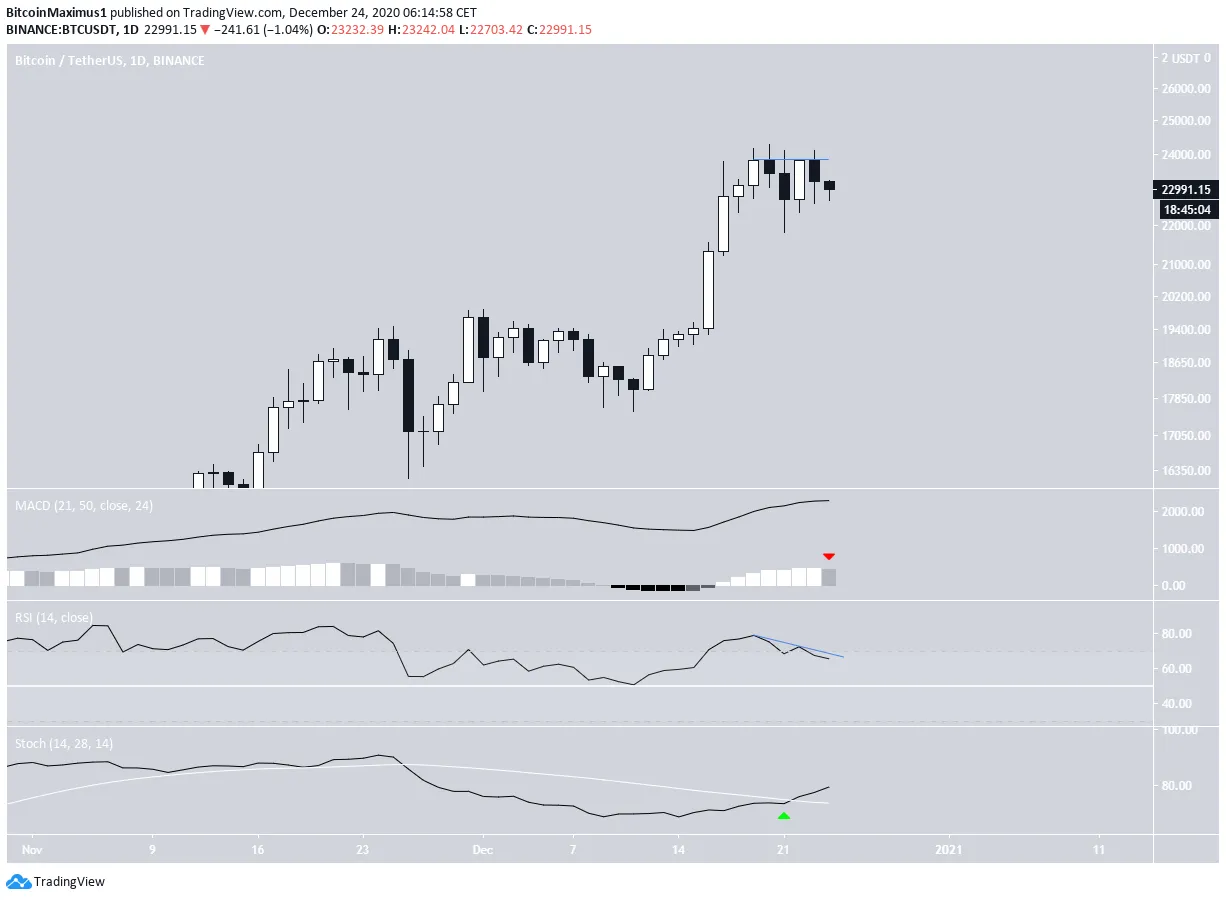
Bitcoin Trend Weakens SlightlyYesterday, the BTC price reached a high of $24,100 in another attempt at reaching a new all-time high. However, the higher prices could not be sustained. BTC was swiftly rejected and proceeded to drop back to $22,600.
Technical indicators have begun to show early signs of weakness, but are not close to confirming a bearish trend.
The MACD is in the process of creating the first lower momentum bar in nine days, but the daily candle has yet to close.
The RSI has generated a bearish divergence and has begun to fall. It may end up invalidating this with a hidden bullish divergence depending on the daily close. The Stochastic oscillator is still bullish and increasing.
Short-Term Movement
Lower time-frames show that BTC has broken down from an ascending support line and validated it as resistance after. In addition, it’s also facing resistance from the minor $23,950 area.
more :
https://beincrypto.com/bitcoin-creates-double-top-after-second-failed-attempt-at-24000/

 .
.  .
.  .
.  .
.  .
.  .
.  Shop
Shop

 Topic: Bitcoin Creates Double Top After Second Failed Attempt at $24,000 (Read 552 times)


 Latest news: