As 2022 unfolds, the crypto decline hasn’t been reversed. Compared to its peak in 2021, this market, which is worth almost $2 trillion, has shrunk by 33.3%, while the trading volume across the entire crypto space remains sluggish. Under such circumstances, trying to profit from spot trading has become extremely challenging. However, contract trading, often regarded as the hope in bear markets, are like a huge treasure house that could not only improve the utilization rate of funds but also, more importantly, allow us to profit in a bear market.
Those who are familiar with contract trading understand that although contracts could be profitable in both bear or bull markets, they also come with high risks. In a black swan event, like the crypto crash on May 19, 2021, the market conditions could change so fast that investors wouldn’t have the time to add more margins. Moreover, if the margin is not sufficient to back the floating loss, your positions would be liquidated, which is commonly known as “forced liquidation”. For instance, recently, many investors have been complaining about the forced liquidation of their long positions due to the changing market conditions.
Essentially, forced liquidation boils down to the following reasons:
- Failure to set up a stop-loss mechanism when opening a position. There are always investors who are blindly confident in their “outstanding” techniques and fail to stop loss in the face of market swings, ultimately resulting in forced liquidation;
- Excessive holdings and leverage. Some investors always plan to make a big gamble. However, they are more likely to end up losing than winning. When you opened a position with a 100x leverage and a low initial margin, forced liquidation may only take a slight market fluctuation;
- Failure to focus on the positions. Investors who don’t have time to keep track of their positions and failed to adjust their leverage in time may not be able to add more margins in times of price swings and would thus suffer from forced liquidation;
- A black swan event like the crypto crash on May 19, 2021. When the industry plummets due to objective factors, manual liquidation could become invalid because the market is swamped by sell orders, thus leading to forced liquidation.
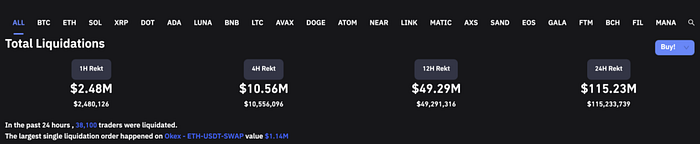
As a forced liquidation will clear all assets in your contract account, we should remain rational when opening a position and account for statistics on buy orders, sell orders, the latest price, as well as the latest trading volume. Moreover, you can also predict the market trend and gain profits while mitigating the risk of forced liquidation using the 8 patterns of the volume-price relationship.
Signal 1The trading volume grows, while the price remains steady: a growth signal. If the trading volume increases after a period of decline, while the price trend remains stable, it may be a growth signal. At this point, you could buy a certain amount and wait for the growth. The following picture shows the candlestick pattern of Bitcoin in November 2021, which is a typical growth signal.
 Signal 2
Both the trading volume and the price grow: a signal to buy. The continued rise in the trading volume accompanied by price growth is the most common signal to long. At this point, you could start buying and open your position. The following picture shows the candlestick pattern of Bitcoin in March 2021, which is a typical signal to buy.
 Signal 3
The trading volume remains steady, while the price grows: a signal for continued purchase. When the trading volume remains stable, while the price keeps rising, you could expand your holdings. The following picture shows the candlestick pattern of Bitcoin in January 2022, which is a typical signal for continued purchase.
 Signal 4
The trading volume drops, while the price grows: a signal to hold. When the trading volume drops, while the price keeps rising, you could hold onto the contract for observation. At this point, the price growth may soon end, and extra caution is required. The following picture shows the candlestick pattern of Bitcoin in February 2022, which is a typical signal to hold.
 Signal 5
The trading volume drops, while the price trend remains steady: a warning signal. When the trading volume plummets, while the price stabilizes after a period of growth, you should stay alert and choose the right time to sell. The following picture shows the candlestick pattern of Bitcoin in January 2022, which is a typical warning signal.
 Signal 6
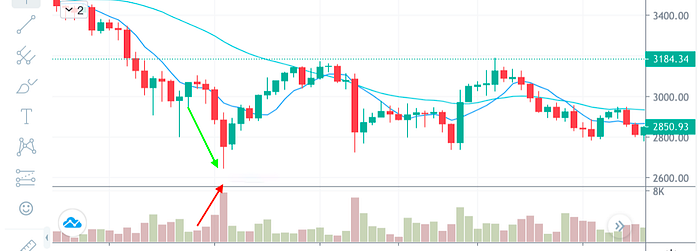
Both the trading volume and the price drop: a signal to sell. When the trading volume continues to drop, while the price also starts to fall, you should choose to stop the loss right away and sell your holdings. The following picture shows the candlestick pattern of Ethereum in May 2021, which is a typical signal to sell.
 Signal 7
The trading volume remains steady, while the price drops: a signal for continued selling. When the trading volume stabilizes, while the price keeps falling, you should sell your holdings. The following picture shows the candlestick pattern of Ethereum in June 2021, which is a typical signal for continued selling.
 Signal 8
The trading volume grows, while the price drops: a signal to stop selling and wait & see. When the trading volume grows after a period of drastic falls, while the price may rebound, you should stop selling and wait & see. The following picture shows the candlestick pattern of Ethereum in September 2021, which is a typical signal to stop selling and wait & see.
It should be noted that these patterns do not apply to all trades in the crypto market. Instead, they are simply helpful tools. To mitigate the risk of forced liquidation, in addition to analyzing the relevant data and predicting the general market trend, you can also set up a reasonable leverage ratio before opening a position. More importantly, you should avoid going all-in on a contract on the spur of the moment. You can also determine the stop-loss price beforehand according to the acceptable losses. In addition, it’s important to keep track of the changes in your positions so that more margins can be added in time to prevent forced liquidations.

 .
.  .
.  .
.  .
.  .
.  .
.  Shop
Shop

 Topic: 7 Signals to Help You Stay Away from Forced Liquidation (Read 861 times)


 Latest news: