BTCUSD and XRPUSD Technical Analysis – 02nd NOV, 2021 BTCUSD: Bullish Ascending Channel Above $60,000
Bitcoin continues to trade steadily above $60,000 in the European trading session today. Yesterday, we saw the price of BTCUSD plummet below $60,000 but soon with renewed buying pressure it touched an intraday high of $62,443.
The price of bitcoin is now in the consolidation phase after recovering from its losses last week which saw the prices touching a low of $58,212. This short-term bearish correction is a stepping stone towards its next leg of bull run towards $65,000.
Bitcoin is now moving above its both 100 hourly simple and exponential moving averages. Relative strength index appears to be neutral signifying sideways movements for the time being.
Medium to long term outlook remains bullish for BTCUSD with targets of $70,000 before the end of this month.
Bitcoin is slowly pulling back from the selloff that was seen last week, and is in the process of creating a bullish ascending channel this week.
- Bitcoin recovered from its losses last week and is now trading above its pivot level of $61,632
- Williams percent range is indicating OVERBOUGHT level
- The price is now trading above its classic support level of $61,200
- All the moving averages are giving a STRONG BUY signal at the current market level of $61,563
Bitcoin: Recovery From Weekend Losses, March Towards $61,500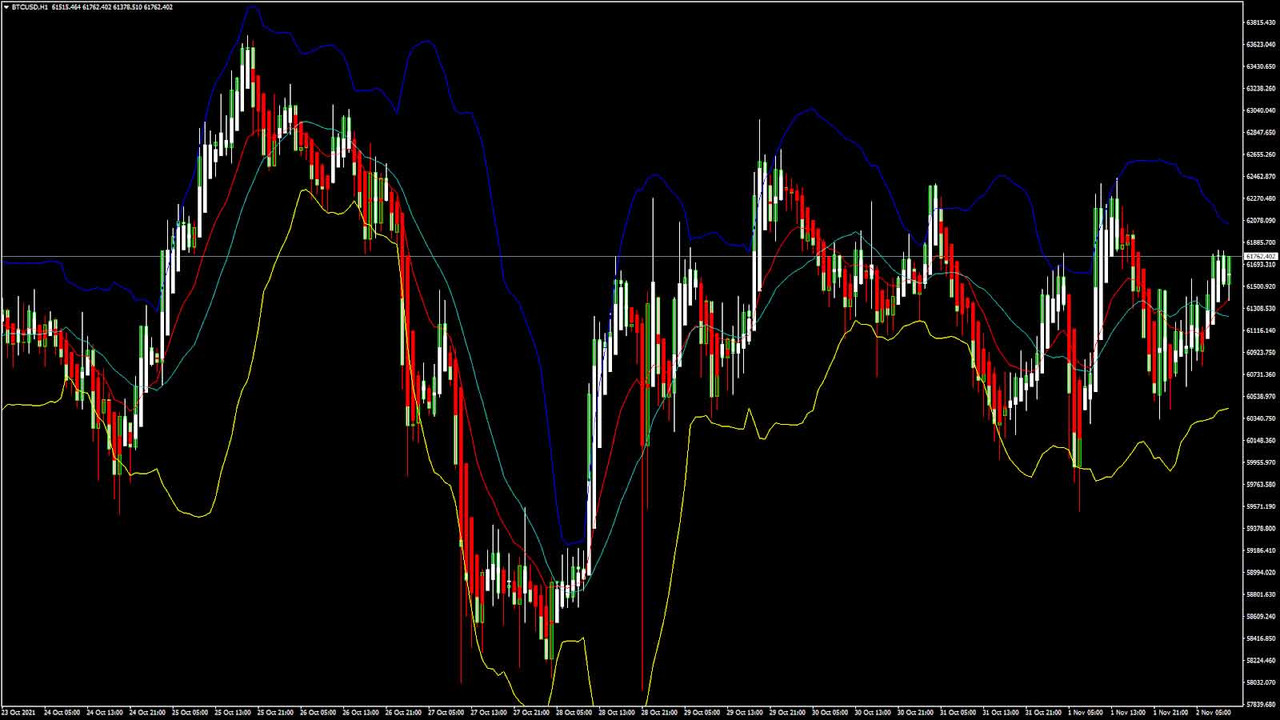
BTCUSD has gone down by 8% from its all-time high price of $66,987, and we saw that this price action was achieved after sub-bearish moves below $60,000. This is an indication of a fresh upwards move in bitcoin which can break its all-time high level soon.
The price of BTCUSD is now facing its Camarilla resistance level of $61,569 and Fibonacci resistance level of $61,891, after which the path towards $63,000 will get cleared.
In the last 24hrs BTCUSD has gone DOWN by -0.26% with the price change of +104$, and has a 24hr trading volume of USD 34.007 billion.
Bitcoin Volatility Index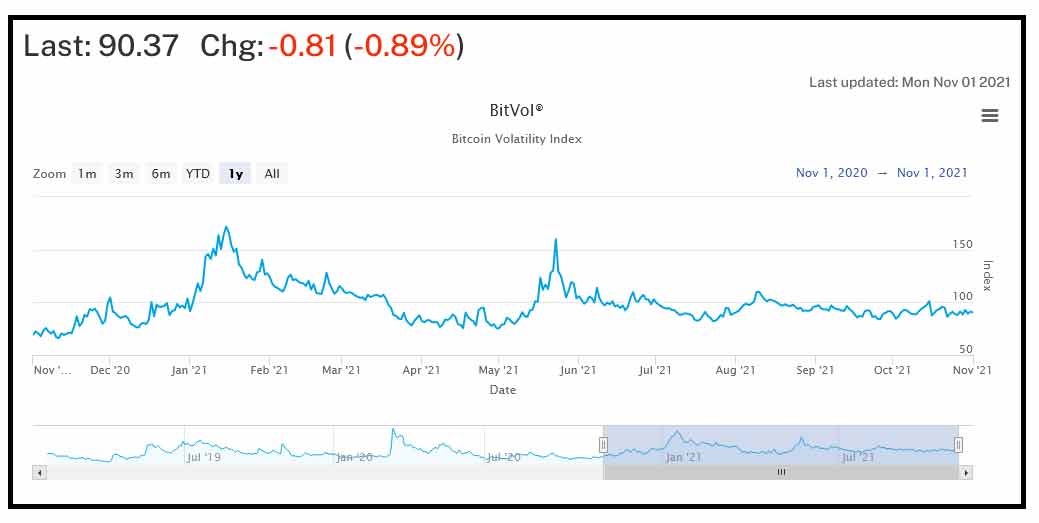
The volatility index of bitcoin shows the constant range of 85 to 95 in the preceding 3 months. This also has a significance since the value of holdings in bitcoin for the investors needs to remain stable.
With the introduction of the bitcoin ETFs, we should expect stable price movement, continued appreciation in the form of attracting more cash investments, and increased total market capitalization.
At present, the TMC of bitcoin is at $1,160 billion USD.
The Week AheadThe price of BTCUSD is holding above the important psychological level of $60,000 and a positive momentum is seen in the short term range. It is crucial for the price to hold above the $60,000 handle for the next bitcoin rally towards $63,000.
This week, BTCUSD is expected to cross $64,000, and aim for upsides of $66,000 to $68,500 the next week. Both the medium term and long term outlooks remain positive. Next week, we could witness BTC printing above the $65,000 mark.
Technical Indicators:Bull/Bear power (13-day): at 183.82 indicating a BUY
Commodity channel index (14-day): at 96.86 indicating a BUY
Moving averages convergence divergence (12,26): at 140.50 indicating a BUY
Ultimate oscillator: at 56.51 indicating a BUY
Read Full on FXOpen Company Blog...

 .
.  .
.  .
.  .
.  .
.  .
.  Shop
Shop

 Topic: Daily Market Analysis By FXOpen (Read 58801 times)


 Latest news: