BTCUSD Analysis: Hammer Pattern above $25,838
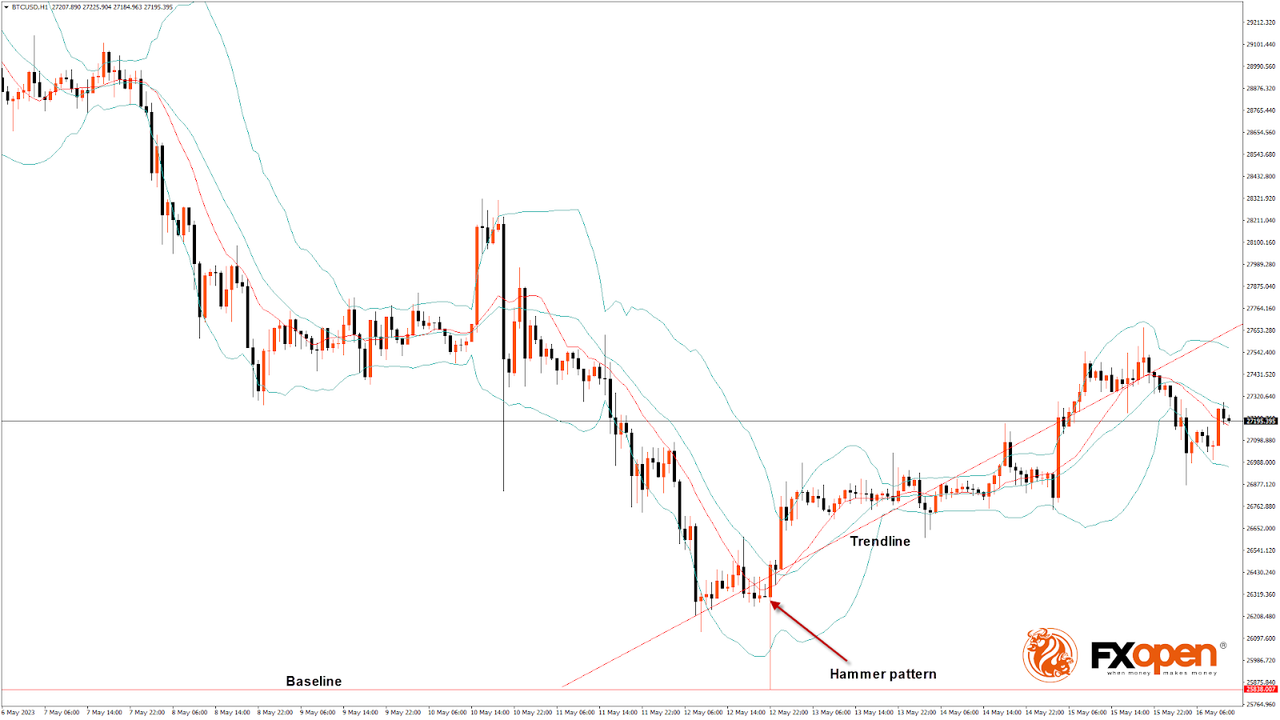
Bitcoin price continues its bullish momentum from last week, and after touching a low of $25,838 on May 12, we can see a move towards a consolidation phase, after which we are expecting upsides in the range of $28,500-$29,000.
We can clearly see a hammer pattern above the $25,838 handle on the H1 timeframe.
Bitcoin today continues to move in a consolidation phase, after which we can see upside moves towards the $27,000 handle.
Both the STOCH and Williams’s percent range are in overbought zones, which means that in the immediate short term a decline in the price is expected.
We can also see the formation of a bullish harami pattern in the 15-minute and weekly timeframes.
The relative strength index is at 48.98, indicating a neutral demand for Bitcoin and the continuation of the consolidation in the markets.
Bitcoin price is now moving above its 100-hour simple moving average and its 100-hour exponential moving average.
Most of the major technical indicators are giving a bullish signal, which means that in the immediate short term, we are expecting targets of $27,500 and $28,500.
The average true range indicates low market volatility with mild bullish momentum.
- Bitcoin price bullish continuation is seen above $25,838.
- The RSI remains below 50, indicating a neutral market.
- The Bitcoin price is now trading below its pivot level of $27,242.
- The short-term range is mildly bullish.
- Bitcoin price is ranging near the support of the channel and triangle.
 VIEW FULL ANALYSIS VISIT - FXOpen Blog...Disclaimer: This Forecast represents FXOpen Companies opinion only, it should not be construed as an offer, invitation or recommendation in respect to FXOpen Companies products and services or as Financial Advice.

 .
.  .
.  .
.  .
.  .
.  .
.  Shop
Shop

 Topic: Daily Market Analysis By FXOpen (Read 59253 times)


 Latest news: