Voted Coins
follow us on twitter . like us on facebook . follow us on instagram . subscribe to our youtube channel . announcements on telegram channel . ask urgent question ONLY . Subscribe to our reddit . Altcoins Talks Shop Shop


This is an Ad. Advertised sites are not endorsement by our Forum. They may be unsafe, untrustworthy, or illegal in your jurisdiction. Advertise Here

Author Topic: Cryptocurrency Market News From tradecoind2.com  (Read 29173 times)

Offline NewspaperD2

  • Sr. Member
  • *
  • Activity: 349
  • points:
    14153
  • Karma: 0
  • Trade Count: (0)
  • Referrals: 0
  • Last Active: May 14, 2024, 06:23:20 AM
    • View Profile

  • Total Badges: 7
    Badges: (View All)
    100 Posts 50 Posts Search
Re: Cryptocurrency Market News From tradecoind2.com
« Reply #90 on: September 30, 2023, 06:04:22 AM »


Bitcoin (BTC) price volatility increased slightly in September. Monthly opening close to $26,000; The price dropped to $24,900 but is currently trading at $27,000.

These four analysts used different indicators to make predictions about Bitcoin in the near term.

Elliott Wave predicts a recovery

Technical analysts use Elliott Wave theory as a means to identify long-term price patterns and investor psychology, helping them determine the direction of a future trend.

This method was used to predict the September 11 bottom and subsequent recovery.

Both CryptoTony_ and AltstreetBet believe that the September 11 bottom is the low of the corrective wave A. They then claim that the price will bounce up soon and complete wave B in the process.

After the bounce, BTC price reached a high of $27,483 on September 19 before decreasing slightly. The price then started another upward movement on September 27.

Although the movement so far has been as predicted, the number of waves is yet to be confirmed.

If the recovery is indeed part of wave B, the price will peak inside the 0.5-0.618 Fib retracement resistance zone at $28,400-$29,200 before falling to $23,000 and completing wave C.

However, a decisive close above the 0.618 Fib level would mean the price has bottomed. In that case, Bitcoin could rise to a yearly high of $31,800, a 17% increase from current prices.


BTC/USDT Daily Chart | Source: TradingView
 

Deviation and retraction result in upward movement
To make accurate predictions for Bitcoin’s movement in September, two other crypto traders used deviations below the horizontal support zone and subsequent recovery.

Anbessa100 and Profit8lue both believe that the price will deviate below the $25,400 zone.

Indeed, the price created a deviation and rose to a long-term descending resistance line on September 19.

However, it has decreased since then. A breakout above this trendline would go a long way in showing that BTC has begun a trend reversal to the upside. This could take BTC price to the 0.5 – 0.618 Fib retracement resistance level, a 7% increase from current prices.


BTC/USDT Daily Chart | Source: TradingView
 

A decisive breakout above 0.618 is needed to confirm a trend reversal to the upside and rally to yearly highs

Source:
https://tradecoind2.com/top-analyst-correctly-predicted-btc-price-movement-in-september-whats-next/

Altcoins Talks - Cryptocurrency Forum

Re: Cryptocurrency Market News From tradecoind2.com
« Reply #90 on: September 30, 2023, 06:04:22 AM »

This is an Ad. Advertised sites are not endorsement by our Forum. They may be unsafe, untrustworthy, or illegal in your jurisdiction. Advertise Here


Offline NewspaperD2

  • Sr. Member
  • *
  • Activity: 349
  • points:
    14153
  • Karma: 0
  • Trade Count: (0)
  • Referrals: 0
  • Last Active: May 14, 2024, 06:23:20 AM
    • View Profile

  • Total Badges: 7
    Badges: (View All)
    100 Posts 50 Posts Search
Re: Cryptocurrency Market News From tradecoind2.com
« Reply #91 on: September 30, 2023, 06:11:45 AM »


Blockchain authentication. Payment between different network layers. Digital asset recommendations in the metaverse.

These are some of the areas the research and development efforts PayPal is focusing on, according to a series of recently published patent applications.


PayPal

The most recent filing, published on Thursday and first filed in March 2022, goes into detail about how validators or miners are selected during the process of adding transactions to the blockchain. The document states that the company’s disclosed techniques could “enable smooth steering of blockchain requests to a desired subset of miners/validators.”

Three other patent applications, released on September 21, were also filed in March 2022.

One application laid out new “methods and systems” to enable offchain transactions through the NFT marketplace.

Another application refers to the concept of the so-called omniverse, which in this context suggests a product related to the multi-metaverse. PayPal says it has developed an “online transaction processor” that will provide recommendations on what digital assets users should buy based on the user’s blockchain preferences and what metaverse they are compatible with. work the most.

The third application describes another conceptual online transaction processor. The goal of this processor is to facilitate payments between users and merchants operating on different network layers (layer 1 and layer 2) in a more efficient manner.

In short, these apps provide a window into PayPal’s thinking as it built its suite of crypto products and services.

For example, with PayPal releasing a stablecoin in August, these proposals open the door towards PayPal using the technology for payments. Venmo, the company’s popular payments app, enabled electronic money transfers in May.

Source:
https://tradecoind2.com/this-is-a-sign-paypal-is-interested-in-layer-2-nfts/

Altcoins Talks - Cryptocurrency Forum

Re: Cryptocurrency Market News From tradecoind2.com
« Reply #91 on: September 30, 2023, 06:11:45 AM »

This is an Ad. Advertised sites are not endorsement by our Forum. They may be unsafe, untrustworthy, or illegal in your jurisdiction. Advertise Here


Offline NewspaperD2

  • Sr. Member
  • *
  • Activity: 349
  • points:
    14153
  • Karma: 0
  • Trade Count: (0)
  • Referrals: 0
  • Last Active: May 14, 2024, 06:23:20 AM
    • View Profile

  • Total Badges: 7
    Badges: (View All)
    100 Posts 50 Posts Search
Re: Cryptocurrency Market News From tradecoind2.com
« Reply #92 on: September 30, 2023, 06:16:00 AM »
Fetch.ai (FET) price completed a bullish pattern at a key support zone and broke above the short-term resistance line. A sharp increase is possible in the next few days.

Bullish model

Fetch.ai (FET) price has been moving higher since the formation of a Pin bar candle during the week of August 14-21. This move confirmed the $0.17 area as support (blue arrow) and forming a double bottom model when compared to the bottom created in mid-June.

The weekly candle created from August 28 to September 3 is a bullish engulfing candle and helps the price break above the neckline of the double bottom pattern. This suggests that FET may have bottomed and a new rally is on the horizon.

Currently, FET price is in the process of confirming the neckline of the double bottom pattern as support (blue arrow). If successful, FET price could rally to the key resistance zone at $0.385-$0.439, formed by the 0.5-0.618 Fib retracement level of the entire downtrend from the yearly high at $0.61 . This price range corresponds to a maximum increase of 100% from the current price level.

The weekly RSI favors the bullish case as a significant bullish divergence formed before the entire upward move and the divergence line remains intact.


FET/USDT Weekly Chart | Source: TradingView
 

The resistance line is descending
The 4-hour chart shows that FET price has broken above a descending resistance line formed from the local high at $0.27 on September 5. This suggests that the short-term correction has ended and a A new price increase is likely to follow.

In fact, FET price also broke out above the small resistance area at $0.215 and continuously created bullish Pinbar candles in the past 24 hours. It means the bulls are buying aggressively at lower levels.

Therefore, FET price could rally to the next resistance zone at $0.24 and above it to $0.27 in the next few days.


FET/USDT 4-hour chart | Source: TradingView
 

Conclude
Technical indicators suggest that FET prices are poised to move higher. The nearest target is $0.24 going higher to $0.27.

The weekly timeframe suggests the possibility of the start of a new rally with a potential target of the $0.385-$0.439 zone.

Source:
https://tradecoind2.com/fetch-ai-fet-price-could-increase-100-in-the-near-future-heres-why/

Offline NewspaperD2

  • Sr. Member
  • *
  • Activity: 349
  • points:
    14153
  • Karma: 0
  • Trade Count: (0)
  • Referrals: 0
  • Last Active: May 14, 2024, 06:23:20 AM
    • View Profile

  • Total Badges: 7
    Badges: (View All)
    100 Posts 50 Posts Search
Re: Cryptocurrency Market News From tradecoind2.com
« Reply #93 on: October 01, 2023, 10:20:01 AM »


Good news for those who support Terra (LUNA), the class action lawsuit in the United States has been voluntarily withdrawn by the plaintiffs. This is the second case to be withdrawn, showing a positive trend for the company.

Terraform Labs’ new CEO, Chris Amani, expressed relief and determination on the matter in his statement.

“The last class action lawsuit against Terra in the United States has been withdrawn by the plaintiffs, bringing the count to two. As long as these baseless legal claims continue to fail, we will continue to fight.”

Coming to the details of the case, first by Nick Patterson and then on behalf of all others similarly situated Terraform Labs, Jump Crypto, Jump Trading, Tribe Capital, Definance Capital/Definance Technologies, Three Arrows Capital, Nicholas Platias and Do Kwon . A countersuit was filed.

However, lead plaintiff Michael Tobias and plaintiff Nick Patterson have voluntarily withdrawn their lawsuit against defendants Terraform Labs and Do Kwon, according to a notice sent to the court and all parties involved.

The notice further clarifies that neither the plaintiffs nor their attorneys have received or will receive any compensation for this retraction.

Source:
https://tradecoind2.com/the-final-class-action-lawsuit-against-terra-and-terraform-labs-has-been-withdrawn/

Offline NewspaperD2

  • Sr. Member
  • *
  • Activity: 349
  • points:
    14153
  • Karma: 0
  • Trade Count: (0)
  • Referrals: 0
  • Last Active: May 14, 2024, 06:23:20 AM
    • View Profile

  • Total Badges: 7
    Badges: (View All)
    100 Posts 50 Posts Search
Re: Cryptocurrency Market News From tradecoind2.com
« Reply #94 on: October 01, 2023, 10:33:38 AM »


About 2,500 ETH ($4 million) from wallets linked to the post-collapse FTX exchange attack are being moved for the first time in nearly a year.

This amount is divided through many transactions. Of this, 700 ETH was transferred using Thorchain Router, a privacy-focused cross-chain bridge. 1,200 ETH was transferred through Railgun, a privacy-focused DeFi wallet that allows for the concealment of transactions. 550 ETH remains in another wallet .

The hacker still has 12,500 ETH ($21 million) in the original wallet.

In addition, hackers still hold a significant amount of other altcoins including:

– Tether (USDT): $3.97 million

– DAI (DAI): $1.69 million

– Binance Coin (BNB): $42.88 thousand

– Bitcoin (BTC): $42.28 thousand

– USC Coin (USDC): $30.24 thousand

– Wrapped Bitcoin (WBTC): $8.84k

The identity of the FTX attacker remains a mystery
Exactly how much money was withdrawn from FTX and who did it remains a mystery.

Accounts tied to the FTX exchange and its US branch were depleted on November 11, 2022, almost immediately after the filing for Chapter 11 bankruptcy protection and the founder’s disgrace. Sam Bankman-Fried resigned.

Immediately after the hack, approximately 21,500 ETH ($27 million at the time) was converted into stablecoin DAI.

Bankman-Fried is expected to go on trial next week. He pleaded not guilty to all charges.

Source:
https://tradecoind2.com/hackers-on-ftx-exchange-move-millions-of-usd-eth-for-the-first-time-in-nearly-a-year/

Offline NewspaperD2

  • Sr. Member
  • *
  • Activity: 349
  • points:
    14153
  • Karma: 0
  • Trade Count: (0)
  • Referrals: 0
  • Last Active: May 14, 2024, 06:23:20 AM
    • View Profile

  • Total Badges: 7
    Badges: (View All)
    100 Posts 50 Posts Search
Re: Cryptocurrency Market News From tradecoind2.com
« Reply #95 on: October 01, 2023, 10:43:35 AM »


Arbitrum (ARB) price has reached a key resistance area and a breakout could send it soaring. However, it is likely to be rejected when trading inside a bearish formation.

Recently, Arbitrum DAO approved the allocation of 50 million ARB to various projects operating in its ecosystem. This has boosted investor sentiment towards ARB and the tokens in its ecosystem.

Daily outlook

Arbitrum (ARB) price has fallen below a descending resistance line since reaching a local high at $1.35 on July 17. This move has caused the price to fall below the key support zone at $0.92 and peaked with a low of $0.75 on September 11.

ARB price has rebounded since then and formed a bullish structure. Currently, it is retesting the $0.92 resistance area. The bears are likely to defend this zone aggressively as it coincides with the descending resistance line.

The daily RSI broke above its descending resistance line and is above 50, showing that the bulls are trying to make a comeback.

Therefore, ARB price is likely to correct towards the $0.80 support zone, a key level of the recent uptrend, before making another breakout attempt.


ARB/USDT Daily Chart | Source: TradingView
 

Discount model
The 2-hour chart shows that the recovery from the $0.75 low is contained within an ascending parallel channel. This is a bearish model, which often leads to crashes in the majority of cases.

The 2-hour RSI has formed a bearish divergence. This occurs when price increases but momentum decreases and is often followed by a decline.

Therefore, ARB price is likely to drop to the channel’s support line at $0.84.


ARB/USDT 2-hour chart | Source: TradingView

Conclude
The most likely outlook suggests ARB prices could correct in the next few days. The nearest target is $0.84 and lower to $0.80.

Once the correction is complete, ARB price is likely to make another breakout attempt above the $0.92 resistance area.

Source:
https://tradecoind2.com/arbitrum-arb-price-approaches-critical-resistance-is-a-breakout-happening/

Offline NewspaperD2

  • Sr. Member
  • *
  • Activity: 349
  • points:
    14153
  • Karma: 0
  • Trade Count: (0)
  • Referrals: 0
  • Last Active: May 14, 2024, 06:23:20 AM
    • View Profile

  • Total Badges: 7
    Badges: (View All)
    100 Posts 50 Posts Search
Re: Cryptocurrency Market News From tradecoind2.com
« Reply #96 on: October 01, 2023, 10:49:20 AM »


XRP Ledger’s native token

According to popular analyst Egrag Crypto split on platform amazed by 300% or more”.

By meticulously analyzing these movements and averaging the increases, EGRG revealed XRP has the potential to increase in price by up to 1,160%. This analysis builds on an exploration of the 4-month timeframe, providing further insight into the anticipated recovery.

Building on previous reporting, EGRG described two trading arenas for XRP and the emergence of a “Steel Foundation” – a historical support for XRP price . Analyst JD noted that XRP’s market capitalization could soon increase after looking at the monthly chart.

The analyst highlighted holding the market cap above the 10-year trendline as a fundamental support level. Analysis shows that XRP has held this trend line since 2015, creating a symmetrical triangle.

Symmetrical triangles are popular patterns in technical analysis, signifying a period of consolidation and uncertainty in the market, and can be a continuation or reversal pattern depending on the direction of its breakout.


Source: JD
 

XRP’s previous symmetrical triangle was broken to the upside during the 2017 bull run, which saw it move to a new all-time high (ATH) above the $3 mark, before entering a bull run. significant adjustment. At the time of writing, XRP is trading at $0.51.

Source:
https://tradecoind2.com/analysts-xrp-price-predictions-show-over-1000-upside-potential-to-6-70/

Altcoins Talks - Cryptocurrency Forum

Re: Cryptocurrency Market News From tradecoind2.com
« Reply #96 on: October 01, 2023, 10:49:20 AM »


Offline NewspaperD2

  • Sr. Member
  • *
  • Activity: 349
  • points:
    14153
  • Karma: 0
  • Trade Count: (0)
  • Referrals: 0
  • Last Active: May 14, 2024, 06:23:20 AM
    • View Profile

  • Total Badges: 7
    Badges: (View All)
    100 Posts 50 Posts Search
Re: Cryptocurrency Market News From tradecoind2.com
« Reply #97 on: October 01, 2023, 10:53:32 AM »
The US House of Representatives has rejected a bill passed by the US Senate to fund the government, and Kevin McCarthy’s proposals have so far failed to attract the attention of far-right lawmakers in US House of Representatives – all actions indicate the US government is moving towards at least a partial shutdown starting October 1.


A U.S. government shutdown, which occurs when Congress fails to pass funding legislation for the next fiscal year, would prevent all federal agencies and departments from doing anything deemed “nonessential.” necessary”. Even if the shutdown lasts only a few hours – one in February 2018 lasted less than a day – cryptocurrency bills could take a backseat to lawmakers’ other policies as the Activity resumes.

Bills on the good or bad value of digital assets will be paused during the shutdown and financial regulators, including the US Securities and Exchange Commission (SEC) and the Commodity Futures Trading (CFTC), will operate a core team. After the shutdown in 2019, SEC officials had limited enforcement and oversight capabilities.

Crypto Council for Innovation CEO Sheila Warren shared:

“After the shutdown, it is unclear which issues will be at the forefront of congressional attention. In addition to funding the government, the U.S. Congress also faces several statutory deadlines that will require additional legislative action before the end of the year.”

In July, lawmakers on the U.S. House Financial Services Committee voted to pass the Financial Innovation and Technology for the 21st Century Act (FIT), Blockchain Regulatory Certainty Act, Clarity for Payment Stablecoins Act and Keep Your Coins Act. If a shutdown occurs, no action can be taken on these crypto-focused bills – no amendments, no floor votes.

Warren suggested congressional priorities could easily shift from cryptocurrency to any issues that arise amid the government shutdown, and there could be additional distractions as the 2024 election approaches . US Treasury Secretary Janet Yellen also spoke out against “the inaction of the Republican Party in the US House of Representatives” in her speech on September 29, calling the shutdown “dangerous and unnecessary” and could “cause economic headwinds” in the future.

Before any bill was introduced in the US House of Representatives, many Democratic members of the US House Financial Services Committee firmly criticized the US Republican Party at a hearing on May 27. 9, although the focus is on SEC oversight. Virginia Representative Don Beyer is one of the few US Democrats pushing a cryptocurrency-related bill amid concerns about government funding, but lawmakers are unlikely to resolve it. This law before October 1.

Ron Hammond, director of government relations for the Blockchain Association said:

“The impending shutdown shows how difficult it will be to pass any major legislation in a divided U.S. Congress. As for cryptocurrency legislation, the longer the shutdown, the less time the US Congress has to vote on proposals like stablecoins and market structures. But the good news is that the various cryptocurrency bills in the US House of Representatives have strong bipartisan support and will likely take effect in November.”

At the time of writing, the Bitcoin price has dropped below $27,000 but does not appear to be correlated with any news of a congressional spending bill or the SEC moving ahead of schedule in delaying decisions on with spot Bitcoin exchange-traded funds. In contrast, ETH price has been moving above $1,600 over the past 3 days as companies announced their intention to launch ETFs tied to ETH futures in the first week of October.

Source:
https://tradecoind2.com/industry-leaders-and-policymakers-weigh-in-on-the-possibility-of-a-u-s-government-shutdown/

Offline NewspaperD2

  • Sr. Member
  • *
  • Activity: 349
  • points:
    14153
  • Karma: 0
  • Trade Count: (0)
  • Referrals: 0
  • Last Active: May 14, 2024, 06:23:20 AM
    • View Profile

  • Total Badges: 7
    Badges: (View All)
    100 Posts 50 Posts Search
Re: Cryptocurrency Market News From tradecoind2.com
« Reply #98 on: October 02, 2023, 04:36:58 AM »
PEPE’s fourth quarter starts off promising, can it sustain?

There’s hardly a dull chapter in the short history of Pepe – the frog-themed meme coin. The volatile price fluctuations of memecoin, which can make or break a portfolio, have piqued the interest of many crypto watchers.

PEPE develops unpredictably

On September 28, the meme coin increased over 12% in value. Looking at the trajectory, the bulls may have been headed towards higher returns. But unfortunately, they were not able to maintain it.


Source: TradingView
 

A day later, on September 29, PEPE fell more than 3%. While this could be attributed to traders taking profits, it accurately reflects memecoin’s volatility behavior.

What are whales doing?
The market dynamics of a particular address have attracted significant interest.

According to  Lookonchain , traders have been buying and selling PEPE tokens on a regular basis to maximize profits.

After making a whopping $2.34 million from previous trades, the address bought $645,000 worth of PEPE in a single transaction on September 29. Needless to say, the trader is optimistic about the outlook. PEPE’s short-term outlook.

But it is not limited to just one wallet. According to data from Santiment, whales have been accumulating significantly, as evidenced by the spike in supply held by top addresses.


Source: Santiment
 

Furthermore, supply on exchanges has decreased significantly during the week. This suggests that broader market consolidation is underway and PEPE could rise further after testing support levels.

Remember that the chaotic world of memecoin is full of dangers. Investors should be cautious.

Social activity declines
Surprisingly, public opinion around PEPE has dropped after peaking a week ago, despite a steady increase in the token’s value.

Additionally, weighted sentiment has been in negative territory since September 29, suggesting investors have a pessimistic view.


Source: Santiment
 

PEPE originates from the countless dog-themed tokens that are dominating the market. The cryptocurrency has exploded tenfold in just a few days since its launch, attracting a large number of profit-hungry traders.

Source:
https://tradecoind2.com/pepes-fourth-quarter-starts-off-promising-can-it-sustain/

Offline NewspaperD2

  • Sr. Member
  • *
  • Activity: 349
  • points:
    14153
  • Karma: 0
  • Trade Count: (0)
  • Referrals: 0
  • Last Active: May 14, 2024, 06:23:20 AM
    • View Profile

  • Total Badges: 7
    Badges: (View All)
    100 Posts 50 Posts Search
Re: Cryptocurrency Market News From tradecoind2.com
« Reply #99 on: October 02, 2023, 04:46:39 AM »


Shiba Inu (SHIB) price is trading in the middle of a long-term range between $0.0000060 – $0.0000080.

In the lower time frames, SHIB price is trading inside a correction pattern.

Cause of failure below support level

Technical analysis from SHIB’s weekly timeframe suggests a bearish outlook due to price movements.

The descending resistance line rejected SHIB price in July (red symbol). This creates a long upper wick and catalyzes the ongoing downward movement. During the decline, SHIB also broke below the $0.0000080 horizontal zone, which was providing support.

After such breakdowns, horizontal support zones often turn into resistance. Another touch of this zone and subsequent decline would confirm the $0.0000080 zone as resistance. The horizontal zone is very close to the descending resistance trend line.


Source: TradingView
 

The weekly RSI is also falling. With the RSI as a momentum indicator, traders can determine whether the market is overbought or oversold and decide whether to accumulate or sell an asset.

The bulls have the advantage if the RSI is above 50 and sloping up, but if the RSI is below 50 the opposite is true.

At the same time the price was rejected by the trendline, the RSI was also rejected by the 50 level (red circle) and is currently falling. Both are considered signs of a bearish trend.

SHIB price prediction: Will a breakthrough happen?
Analysis from the 12-hour timeframe provides a more optimistic outlook.

The main reason for this is that the price is trading in the upper part of the descending parallel channel. These channels often contain corrective movements, meaning that an eventual breakout from this channel is the most likely price outlook going forward.

The fact that the meme coin trades in the upper part of the channel further aligns with this possibility.

Additionally, the RSI is rising and almost moving above the 50 level (green circle), both of which are signs of an uptrend.

If the cryptocurrency breaks out, it could rally 30% and reach a long-term descending resistance line at $0.0000095.


Source: TradingView
 

However, this bullish analysis will be invalidated if the channel’s resistance line rejects the price.

In that case, a 12% drop to the trendline support at $0.0000065 could be the outlook going forward.

Source:
https://tradecoind2.com/shiba-inu-shib-price-outlook-how-to-create-a-30-gain-in-50-days/

Offline NewspaperD2

  • Sr. Member
  • *
  • Activity: 349
  • points:
    14153
  • Karma: 0
  • Trade Count: (0)
  • Referrals: 0
  • Last Active: May 14, 2024, 06:23:20 AM
    • View Profile

  • Total Badges: 7
    Badges: (View All)
    100 Posts 50 Posts Search
Re: Cryptocurrency Market News From tradecoind2.com
« Reply #100 on: October 02, 2023, 04:55:13 AM »


Litecoin (LTC) price has been falling since its yearly high in July, dropping 50% in the process.

This drop caused a breakdown from the long-term ascending support line, taking the price towards the long-term support at $64.

Litecoin returns to long-term horizontal support

Technical analysis from Litecoin’s weekly timeframe shows that the price has been falling since its yearly high of $115 in July. The decline peaked with a low of $56 in August. This is a 50% drop. in 42 days.

During the decline, the cryptocurrency also broke below an ascending support line, formed since June 2022.

Such a break of the long-term structure shows that the previous movement is complete and a new movement has begun in the other direction.

Since the August low, LTC price has been trading inside the $63 horizontal support zone. Previously, this zone acted as resistance at the end of 2022. Due to the continued recovery, it may have turned into support (green symbol).


Source: TradingView


The weekly RSI shows a bearish outlook. With the RSI as a momentum indicator, traders can determine whether the market is overbought or oversold and decide whether to accumulate or sell an asset.

The bulls have the advantage if the RSI is above 50 and sloping up, but if the RSI is below 50 the opposite is true. The indicator is below 50 (red line) and is falling, both of which are signs of a downtrend.

LTC Price Prediction: Will the Double Bottom Catalyze a Rally?
While the weekly timeframe is bearish, the daily chart offers a more bullish outlook. This is due to a few reasons.

First, the price has created a double bottom pattern. This is considered a bullish pattern, meaning it often leads to a breakout.

Second, the double bottom is combined with a bullish divergence (green line) in the RSI indicator. This happens when the decline is not supported by momentum. It often leads to a significant uptrend reversal, as has been the case with Litecoin so far.

If the uptrend continues, it could rally 22% to the previous ascending support line at $80.


Source: TradingView
 

Despite this bullish prediction, a close below the $63 horizontal support area would invalidate the bullish double bottom.

In that case, the price could fall 22% to the $50 support zone.

Source:
https://tradecoind2.com/will-this-price-model-help-litecoin-ltc-increase-by-25/

Offline NewspaperD2

  • Sr. Member
  • *
  • Activity: 349
  • points:
    14153
  • Karma: 0
  • Trade Count: (0)
  • Referrals: 0
  • Last Active: May 14, 2024, 06:23:20 AM
    • View Profile

  • Total Badges: 7
    Badges: (View All)
    100 Posts 50 Posts Search
Re: Cryptocurrency Market News From tradecoind2.com
« Reply #101 on: October 02, 2023, 05:05:52 AM »


Decentralized Oracle protocol Tellor (TRB) has defied bearish sentiment to emerge as one of the bright spots in the crypto landscape in recent weeks. According to CoinMarketCap, TRB price has exploded 270% in the past month, trading at $52.18 at the time of writing.

TRB price increased 270% as whales increased accumulation


Source: CoinMarketCap

Whales impact prices?

With the surge amid a bear market, speculators looking for a quick buck rushed to own TRB.

However, like many other small and mid-cap cryptocurrencies, the upcoming price movements may be dictated by a few powerful investors.

According to data from Lookonchain dated September 28, six whale wallets have accumulated up to 286,375 TRB, worth more than 15 million USD at the current market rate.

TRB price increased 270% as whales increased accumulation


Source: Lookonchain

It was further revealed that all of these addresses were profitable, with a combined profit value of up to $7 million. Lookonchain says that these whales can take profit-taking action at any time.

Because they control 11% of the supply, a whale sell-off could put significant pressure on TRB’s value.

Although whale movements are often seen as a harbinger of what will happen in the future, you should always exercise caution and DYOR (do your own research on an issue you take in through the media). or someone).

Rumors exploded in the media
According to Santiment, the majority of profit-taking took place around September 17. Apparently, this was the time when most TRB holders transferred their coins to exchanges to sell.

Since then, the supply on and off the exchange has not changed. Even so, prices have increased by 47%.

TRB price increased 270% as whales increased accumulation


Source: Santiment

TRB has benefited greatly from the positive buzz. As indicated, the number of mentions in social media dedicated to TRB increased as the price passed $50.

Cryptocurrencies in general soar based on word of mouth and hype. Therefore, rumors may continue to make many investors FOMO and spend money to buy them.

TRB price increased 270% as whales increased accumulation


Source: Santiment

Additionally, investor sentiment is in positive territory, suggesting that the number of positive comments surrounding TRB has overshadowed negative public opinion. This is a good signal for TRB in the short term.

Source:
https://tradecoind2.com/trb-price-increases-270-as-whales-increase-accumulation-whats-going-on/

Offline NewspaperD2

  • Sr. Member
  • *
  • Activity: 349
  • points:
    14153
  • Karma: 0
  • Trade Count: (0)
  • Referrals: 0
  • Last Active: May 14, 2024, 06:23:20 AM
    • View Profile

  • Total Badges: 7
    Badges: (View All)
    100 Posts 50 Posts Search
Re: Cryptocurrency Market News From tradecoind2.com
« Reply #102 on: October 02, 2023, 05:23:22 AM »


Bitcoin price is trading at $26,997 at the time of writing, marking a 60% drop from its all-time peak of $69,000 in 2021. When predicting the next bull market, exports raises questions regarding the potential future price of Bitcoin.

While most predictions are speculative, one analyst has devised a model that leverages historical data to forecast potential peaks and troughs in Bitcoin price over time.

Bitcoin price in previous cycles
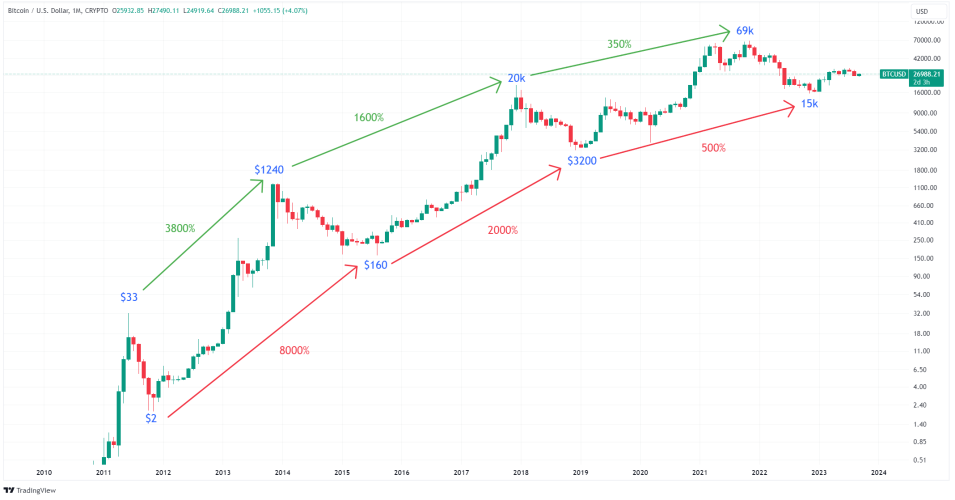

Source: TradingView

Since its inception, Bitcoin has shown outstanding growth that has brought significant benefits to early long-term investors. This price increase can be observed when measuring Bitcoin price from trough to peak and between the highest peaks of consecutive bull markets.

In 2011, BTC peaked at just $33, followed by a peak of $1,240 in 2013, reflecting a 3,800% increase between peaks. Subsequent peaks in 2017 and 2021 were $20,000 and $69,000, representing increases of 1,600% and 350%, respectively. Comparable percentages are also observed when considering the bottoms of different cycles.

Notably, the relative growth between cycles has decreased, likely due to Bitcoin’s increased market capitalization, which requires more capital to influence its price. This decreasing growth is consistent with a mathematical model called logarithmic regression.

Logistic regression model
An analyst has plotted various logarithmic curves on the Bitcoin chart to forecast Bitcoin’s potential tops and bottoms, using time as the only input. Such models can help investors by offering a simple way to see potential market trends and make proactive plans in the unpredictable world of cryptocurrency.


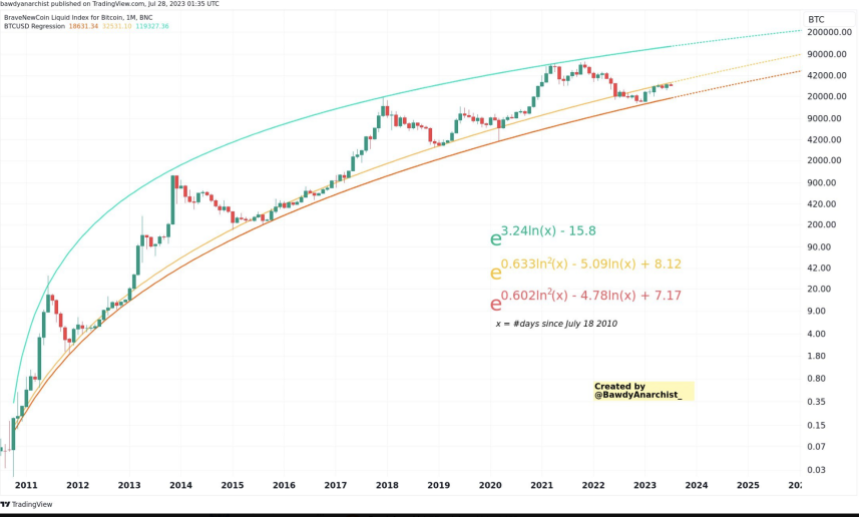
Source: Bawdy Anarchist/ X

Bitcoin’s tops and bottoms typically occur every four years, allowing for predictions of potential Bitcoin prices in upcoming cycles based on logarithmic regression models.

Bitcoin price prediction

2025-2026: Bitcoin price could peak in the third or fourth quarter of 2025 between $170,000 and $200,000, before bottoming out around $70,000 the following year.
2029-2030: Bitcoin price could peak between $410,000 and $440,000 and bottom the following year at around $230,000.
2033-2034: Bitcoin price could peak between $750,000-800,000 and bottom around $700,000 the following year.
In the late 2030s, the pattern begins to break down as the predicted peaks begin to fall below the predicted troughs, potentially indicating stabilization in Bitcoin’s price after its peak of $750,000-800,000.

Conclude
While models like these make insightful predictions about the potential future price of Bitcoin, it is important to acknowledge their limitations and the need for periodic updates with new data points. . Many external factors, including but not limited to regulatory changes  , technological advances, and macroeconomic conditions, can significantly affect model accuracy.

Furthermore, the unprecedented nature of Bitcoin’s trajectory, having never experienced a recessionary environment, implies the potential for more significant failures than the models can predict. Forecasts should be viewed with caution against broader market trends and analysis as with any financial model.

Source:
https://tradecoind2.com/bitcoin-price-is-predicted-to-reach-170000-by-2025/

Offline NewspaperD2

  • Sr. Member
  • *
  • Activity: 349
  • points:
    14153
  • Karma: 0
  • Trade Count: (0)
  • Referrals: 0
  • Last Active: May 14, 2024, 06:23:20 AM
    • View Profile

  • Total Badges: 7
    Badges: (View All)
    100 Posts 50 Posts Search
Re: Cryptocurrency Market News From tradecoind2.com
« Reply #103 on: October 03, 2023, 04:04:43 AM »
The 2021 bull run has exposed some major weaknesses in the Ethereum (ETH ) blockchain. As a result, the term “Ethereum killer” has gained traction as a way to describe the multiple layers competing for the top spot by trying to overthrow the network’s dominance.

At the present time, Ethereum remains the dominant PoS blockchain in several key areas. Therefore, Layer blockchains like Solana (SOL ) and Avalanche (AVAX ) have not been able to dethrone Ethereum.

ETH’s secret weapon is Layer 2, which has allowed it to overcome previous scalability limitations.

A recent analysis by Grayscale revealed that Optimism (OP ), Base , and Arbitrum (ARB ), which are three Ethereum Layer 2s, have surpassed Avalanche and Solana in terms of total asset volume locked (TVL ).

This is because Ethereum is far ahead of its competitors in terms of adoption and number of active dApps on its network.

https://twitter.com/Grayscale/status/1707874684459778499
 

The Layer 2 network supports Ethereum’s success in overcoming its previous limits. L2 supports transaction processing, allowing dApps to operate efficiently and cost-effectively. There is a key factor that has allowed Layer 2 networks to surpass some Layer 1 blockchains.

While Layer 1 has to build their own dApps and clientele, Layer 2 benefits from Ethereum’s many existing dApps. On top of that, the same Layer 2s can also attract dApps themselves.

https://twitter.com/Grayscale/status/1707874684459778499
 

Can Ethereum Layer 2 ensure market capitalization dominance?
These figures show that Ethereum is still able to meet strong demand and utility at the time of writing. But while its Layer 2 networks have strong TVL growth, they still lag Solana and Avalanche in market capitalization.


Source: Santiment
 

According to the latest data, Solana’s market capitalization is over $9.8 billion, while Avalanche has a market capitalization of $3.45 billion at the time of writing. The most “modest” among the above mentioned Layer 1 is Arbitrum with 1.23 billion USD, followed by Optimism at 1.12 billion USD.

Base has the lowest market capitalization among them, at just $441 million.

It makes sense that Layer 2 has a lower market cap, since their counterparts are Layer 1 networks that have been around longer. However, Layer 2 market capitalization highlights their rapid growth.

Judging by these factors, they will most likely be closer to Solana and Avalanche. These numbers also highlight the fact that it is now more difficult than ever to beat Ethereum.

Source:
https://tradecoind2.com/how-does-ethereum-layer-2-outperform-layer-1/

Offline NewspaperD2

  • Sr. Member
  • *
  • Activity: 349
  • points:
    14153
  • Karma: 0
  • Trade Count: (0)
  • Referrals: 0
  • Last Active: May 14, 2024, 06:23:20 AM
    • View Profile

  • Total Badges: 7
    Badges: (View All)
    100 Posts 50 Posts Search
Re: Cryptocurrency Market News From tradecoind2.com
« Reply #104 on: October 03, 2023, 04:09:38 AM »


September has officially become the worst month of 2023 (so far) as stolen cryptocurrency reached $329.8 million.

On October 2, blockchain security firm CertiK said the most significant contributor to total losses for the month came from the Mixin Network attack on September 23, when the decentralized crosschain transfer protocol had Hong Kong-based company lost $200 million after its cloud service provider was hacked.

https://twitter.com/CertiKAlert/status/1708094695832682893
 

Other major incidents during the month included attacks on exchanges CoinEx and Stake.com, which resulted in losses of $53 million and $41 million, respectively.

North Korea’s Lazarus Group has been criticized as the mastermind behind both attacks. Latest figures from Dune Analytics  claim  that the group now holds $45.6 million in crypto assets.

The attack caused the total amount of cryptocurrency lost due to exploitation (exploitation attack) annually to reach 925.4 million USD. July was the second biggest loss month, with $285.8 million stolen.

Meanwhile, this month also saw $1.9 million lost to exit scams, $400,000 to flash loan attacks and another $25 million to phishing attacks, according to CertiK.

The total amount of money lost in 2023 due to exploits, scams and hacks now reaches 1.34 billion USD.

According to blockchain security company Beosin, total losses from hacks, phishing scams and exit scams are nearly 890 million USD in the third quarter of 2023.

The loss in the third quarter even exceeded the total amount of the first two quarters, which was $330 million in the first quarter and $333 million in the second quarter.


Source:
https://tradecoind2.com/september-was-the-worst-month-of-the-year-as-hackers-made-329-8-million/


ETH & ERC20 Tokens Donations: 0x2143F7146F0AadC0F9d85ea98F23273Da0e002Ab
BNB & BEP20 Tokens Donations: 0xcbDAB774B5659cB905d4db5487F9e2057b96147F
BTC Donations: bc1qjf99wr3dz9jn9fr43q28x0r50zeyxewcq8swng
BTC Tips for Moderators: 1Pz1S3d4Aiq7QE4m3MmuoUPEvKaAYbZRoG
Powered by SMFPacks Social Login Mod