BTCUSD and XRPUSD Technical Analysis – 21st FEB 2023 BTCUSD: Three WHITE Soldiers Pattern Above $22079
Bitcoin was unable to sustain its bearish momentum last week and after touching a low of $22079 the price started to correct upwards against the US dollar, touching a high of $25093 today in the Asian trading session.
We have seen a bullish opening of the markets this week.
We can clearly see the three white soldiers pattern above the $22079 handle which is a bullish reversal pattern because it signifies the end of a downtrend and a shift towards an uptrend.
Bitcoin touched an intraday low of 24681 and an intraday high of 25093 in the Asian trading session today.
We can see that the MACD indicator is back over zero in the weekly time frame indicating bullish trends.
We can see a bullish price crossover with moving average MA50 in the weekly time frame indicating bullish trends.
Both the STOCH and STOCHRSI are indicating overbought levels which means that in the immediate short term, a decline in the prices is expected.
The resistance of the channel is broken in the daily time frame indicating a bullish scenario.
The relative strength index is at 62.08 indicating a STRONG demand for bitcoin, and the continuation of the buying pressure in the markets.
Bitcoin is now moving above its 100 hourly simple moving average and above its 100 hourly exponential moving averages.
Most of the major technical indicators are giving a buy signal, which means that in the immediate short term, we are expecting targets of 25000 and 27500.
The average true range is indicating less market volatility with a strong bullish momentum.
- Bitcoin: Bullish reversal seen above $22079.
- The Williams percent range is giving an overbought signal.
- The price is now trading just below its pivot level of $25005.
- The short-term range is strongly BULLISH.
Bitcoin: Bullish Reversal Seen Above $22079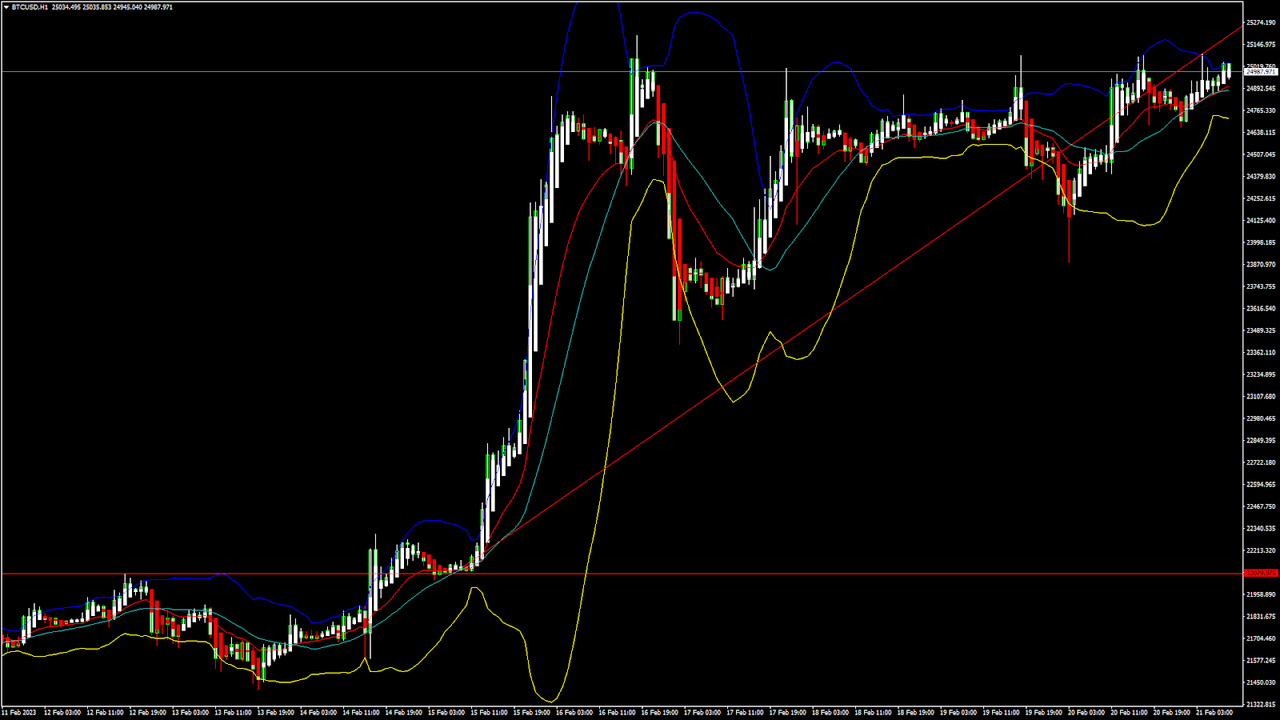
The price of bitcoin is marching ahead of the $25000 levels amid improving consumer sentiments and a shift towards a high demand market.
The momentum indicator is back over zero in the 15-minute time frame indicating a bullish outlook.
The MACD crosses up its moving average in the 15-minute time frame.
We can see that the prices have entered into a supper bullish zone and now we are heading towards the $26000 and $27500 levels.
The immediate short-term outlook for bitcoin is strongly bullish, the medium-term outlook has turned bullish, and the long-term outlook remains neutral under present market conditions.
Bitcoin’s support zone is located at $23074 at which the price crosses 18-day moving average stalls, and $23315 which is a pivot point 2nd support point.
The price of BTCUSD is now facing its classic resistance level of 25077 and Fibonacci resistance level of 25120 after which the path towards 26000 will get cleared.
In the last 24hrs, BTCUSD has increased by 2.14% by 524.45$ and has a 24hr trading volume of USD 27.875 billion. We can see a decrease of 2.34% in the trading volume compared to yesterday, which appears to be normal.
The Week AheadBitcoin needs to continue its bullish moves this week, which will further validate the end of the crypto winter and the start of a bullish run for Bitcoin which was long overdue.
There is an ascending channel forming with the current support at $23165 at which the price crosses the 18-day moving average.
The daily RSI is printing at 66.97 which indicates a VERY STRONG demand for bitcoin and the continuation of the bullish phase present in the markets in the short-term range.
We can see the formation of a bullish trend line from $22079 towards the $25265 level.
The price of BTCUSD is now facing its resistance zone located at $25890 which is a pivot point 2nd resistance level and $26017 which is a 3-10 day MACD oscillator stalls.
The weekly outlook is projected at $27000 with a consolidation zone of $26000.
Technical Indicators:The average directional index (14): is at 32.84 indicating a BUY.
The ultimate oscillator: is at 53.92 indicating a BUY.
The rate of price change: is at 0.979 indicating a BUY.
Bull/bear power (13): is at 204.85 indicating a BUY.
VIEW FULL ANALYSIS VISIT - FXOpen Blog...Disclaimer: This Forecast represents FXOpen Companies opinion only, it should not be construed as an offer, invitation or recommendation in respect to FXOpen Companies products and services or as Financial Advice.

 .
.  .
.  .
.  .
.  .
.  .
.  Shop
Shop

 Topic: Daily Market Analysis By FXOpen (Read 59441 times)


 Latest news: